Let's navigate the Drawing Tools feature on our platform.
Accessing Drawing Tools
Click on the "Draw" icon on the upper left group of icons (Charting Tools). A pop-out window or Drawing palette will appear on the left with over 30 drawing tools. This window can be detached and moved around or reattached.
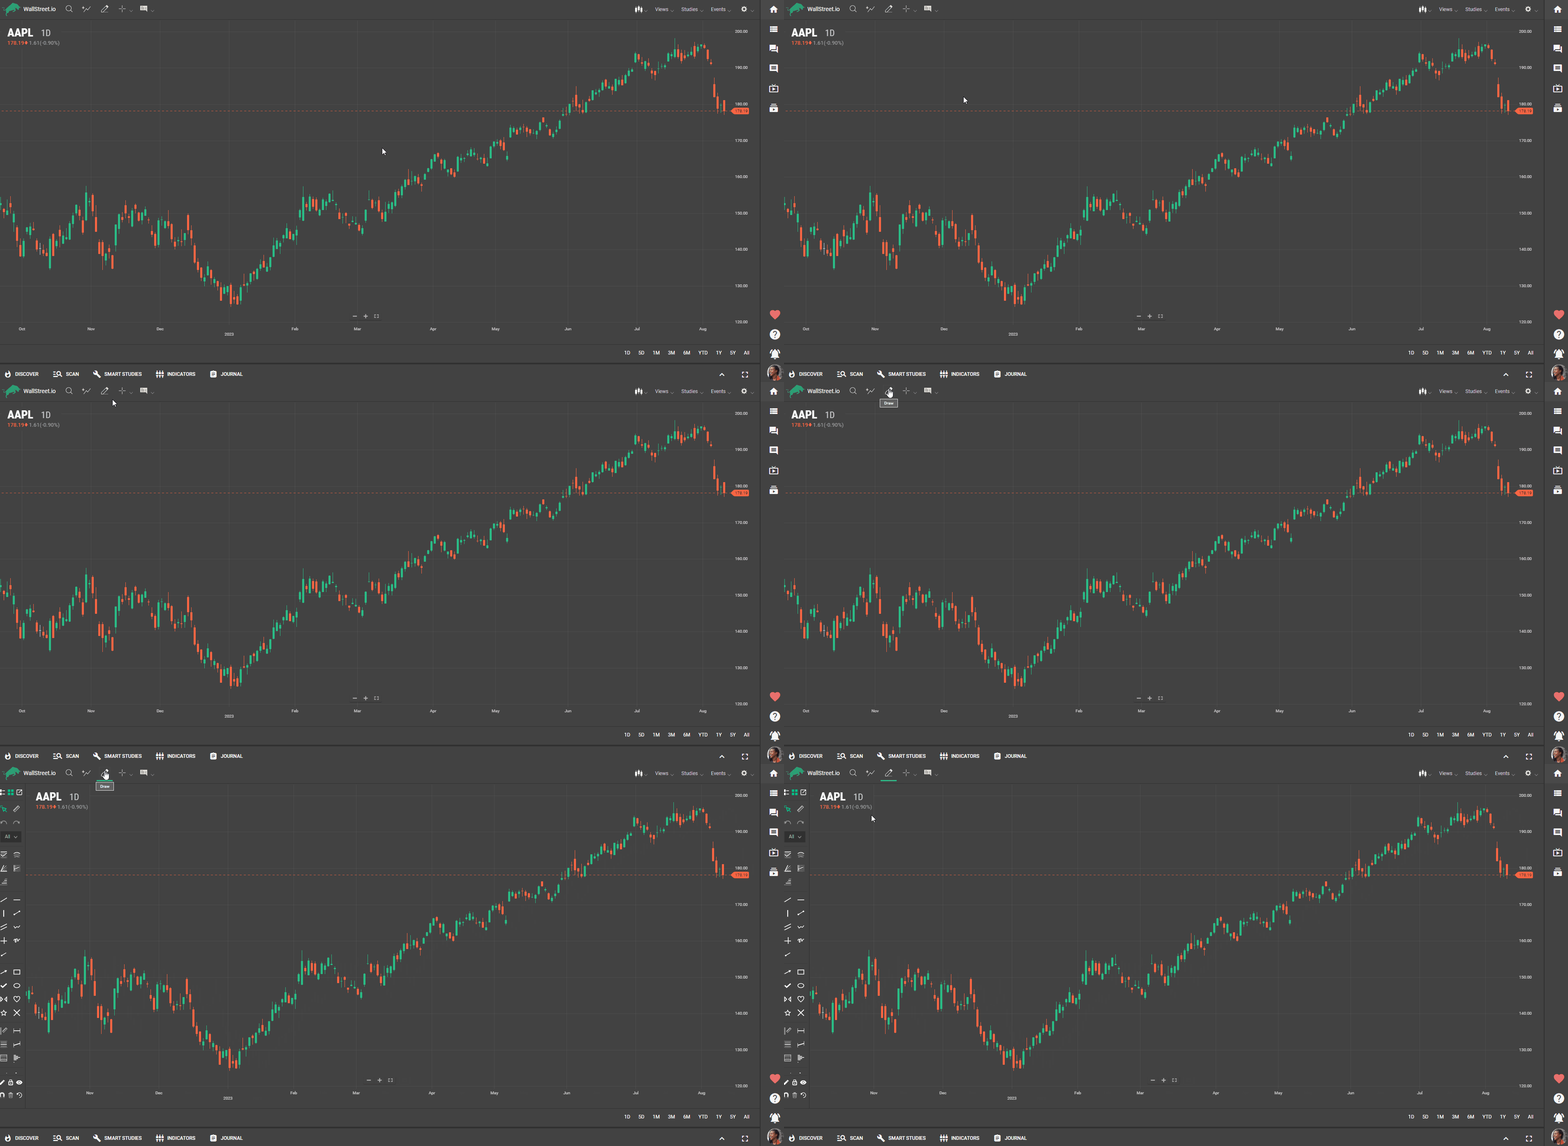
View Modes
The window offers two view modes - 'Icon view' and 'List view'. Switch between them based on your preference.
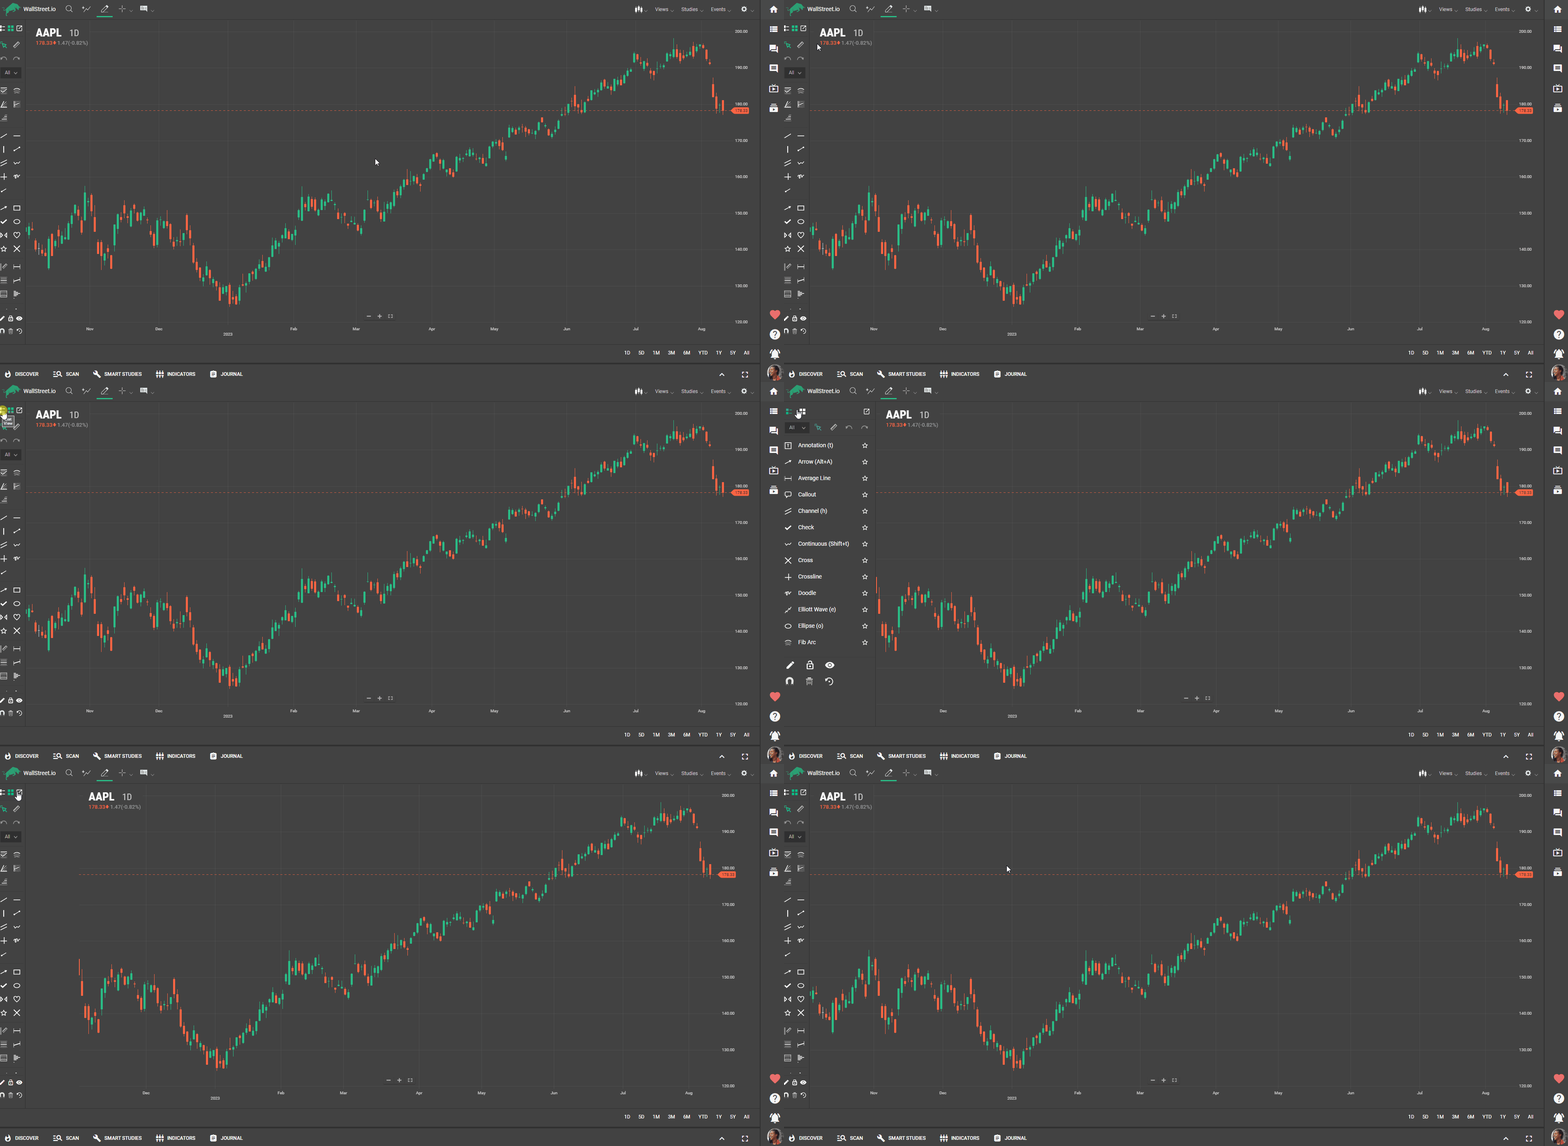
Creating Favorites
You can favorite any drawing tool by clicking the star icon next to it in 'List view' or by right-clicking on it in 'Icon view'. Favorited tools appear at the top of the list.
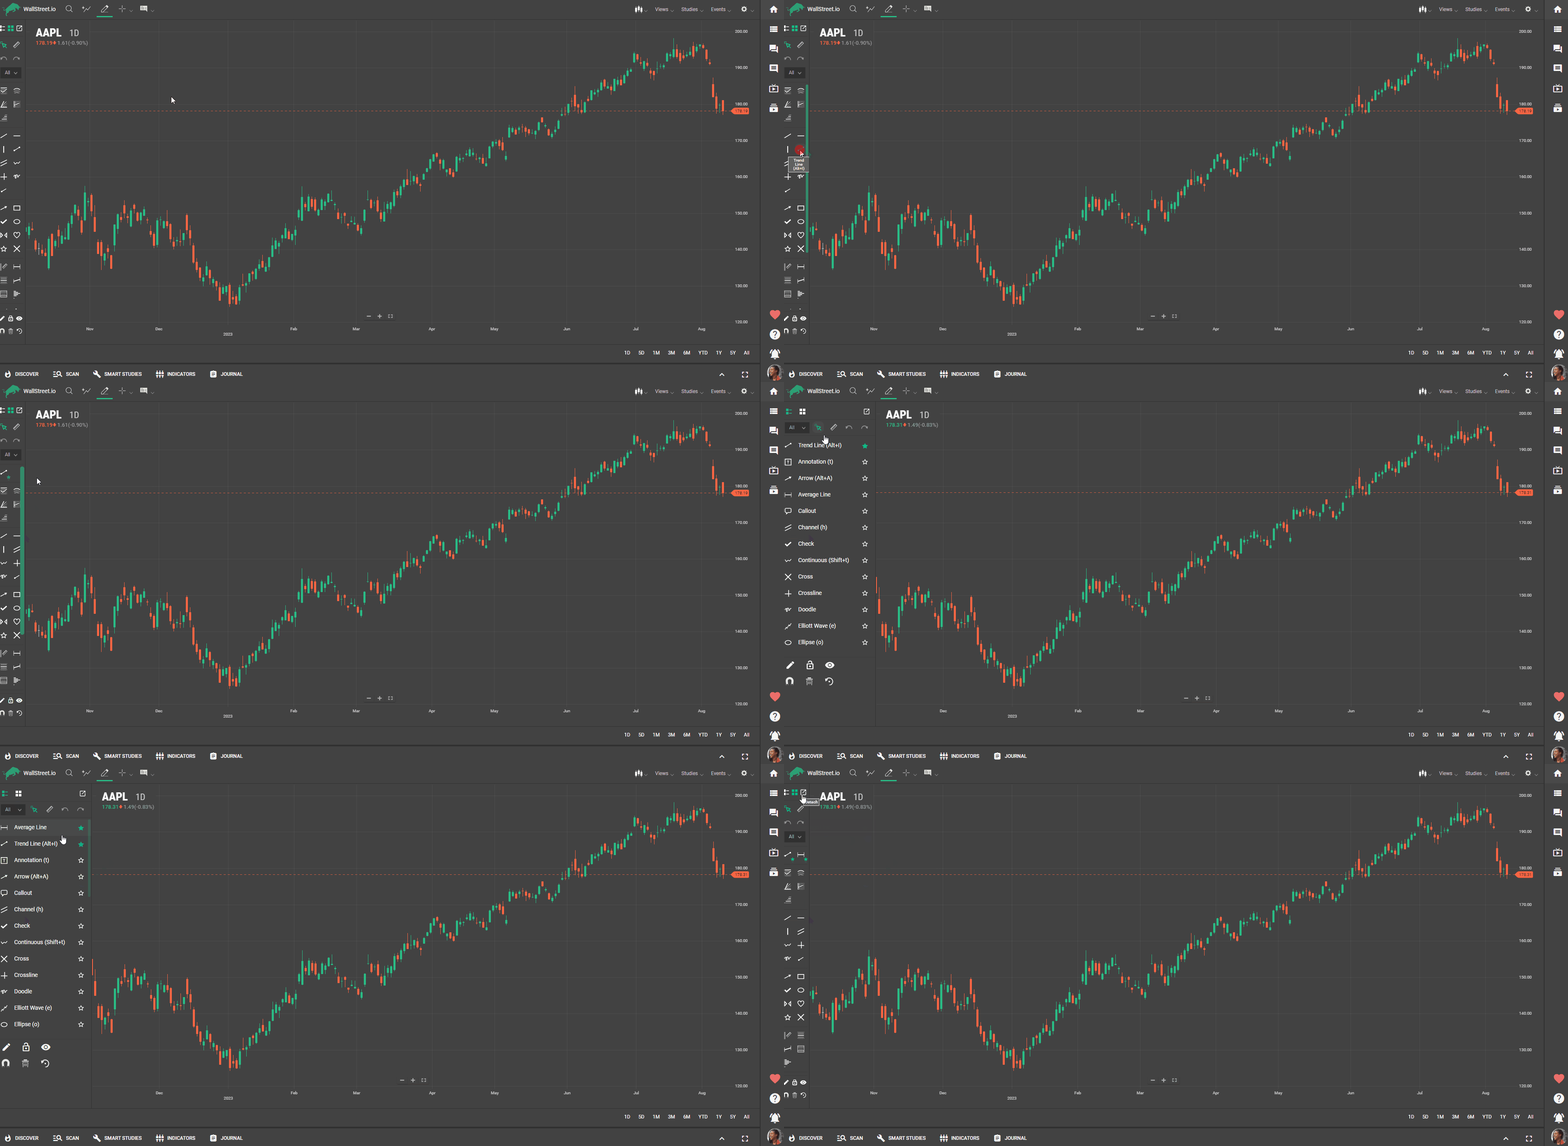
Using Drawing Tools
The default selection is the cursor. Other tools include a Measurement Line to measure moves on the chart, undo and redo icons, and categories of different drawing tools.
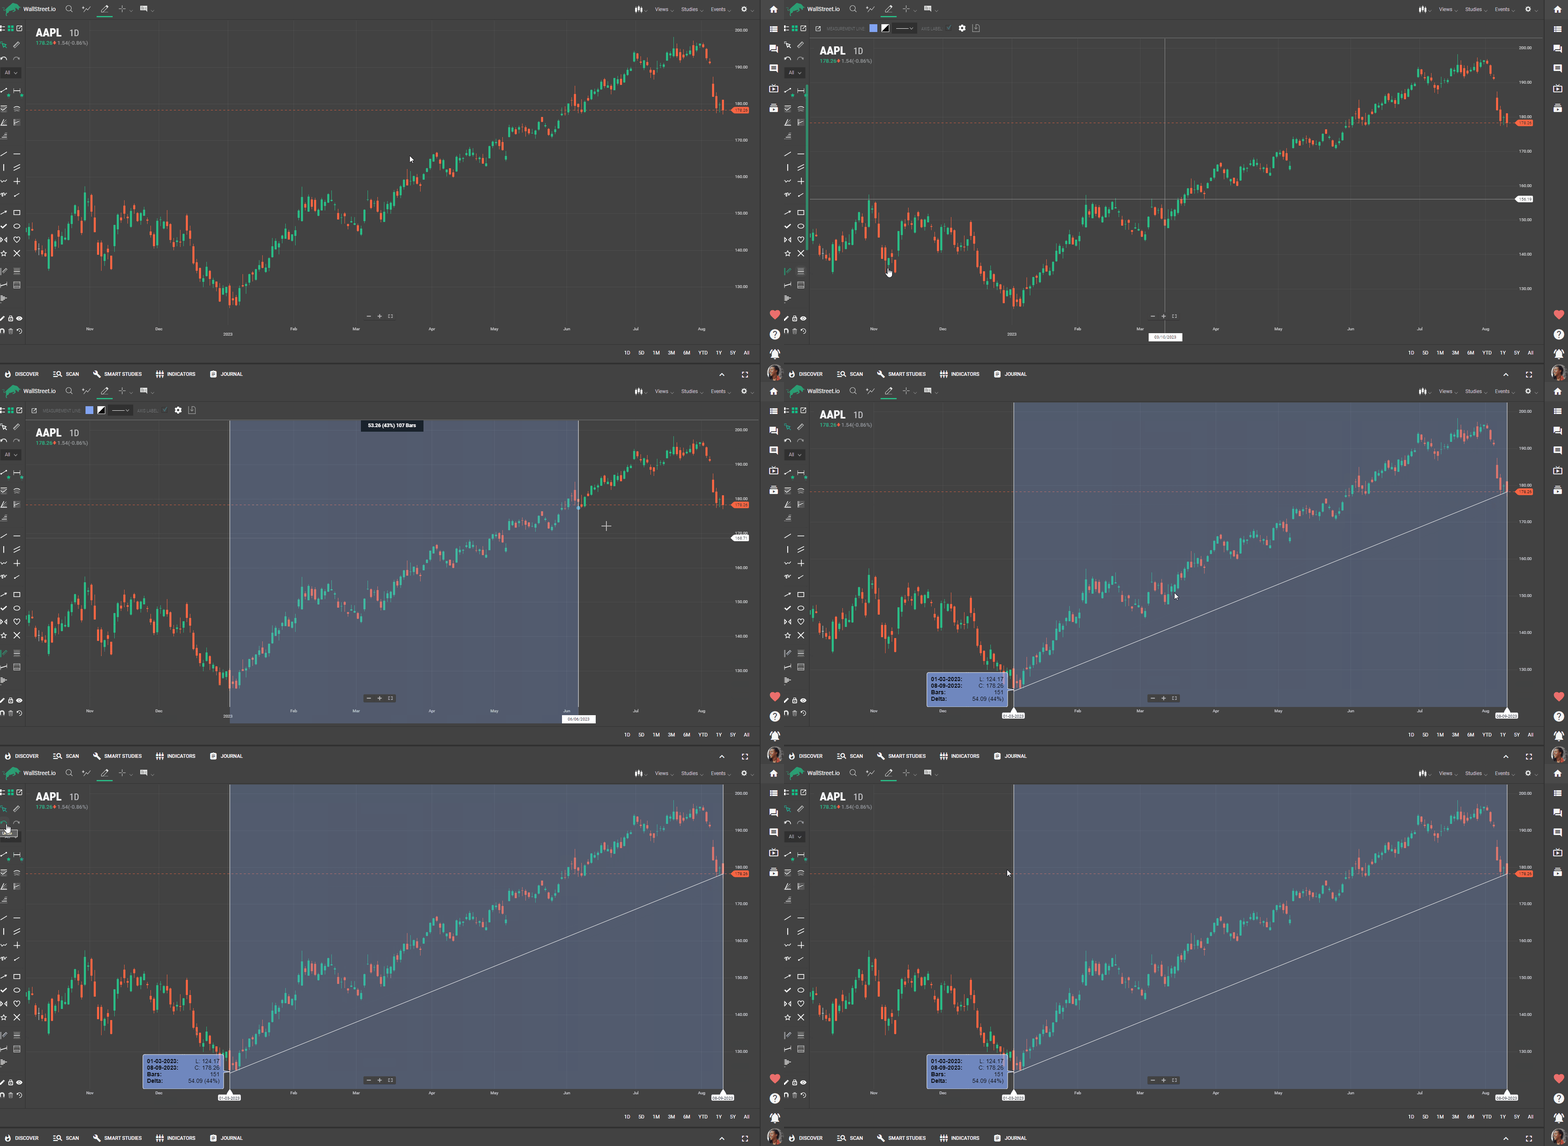
Staying in Drawing Mode
To continuously draw without reverting to the cursor, click the pencil icon labeled 'stay in drawing mode'.
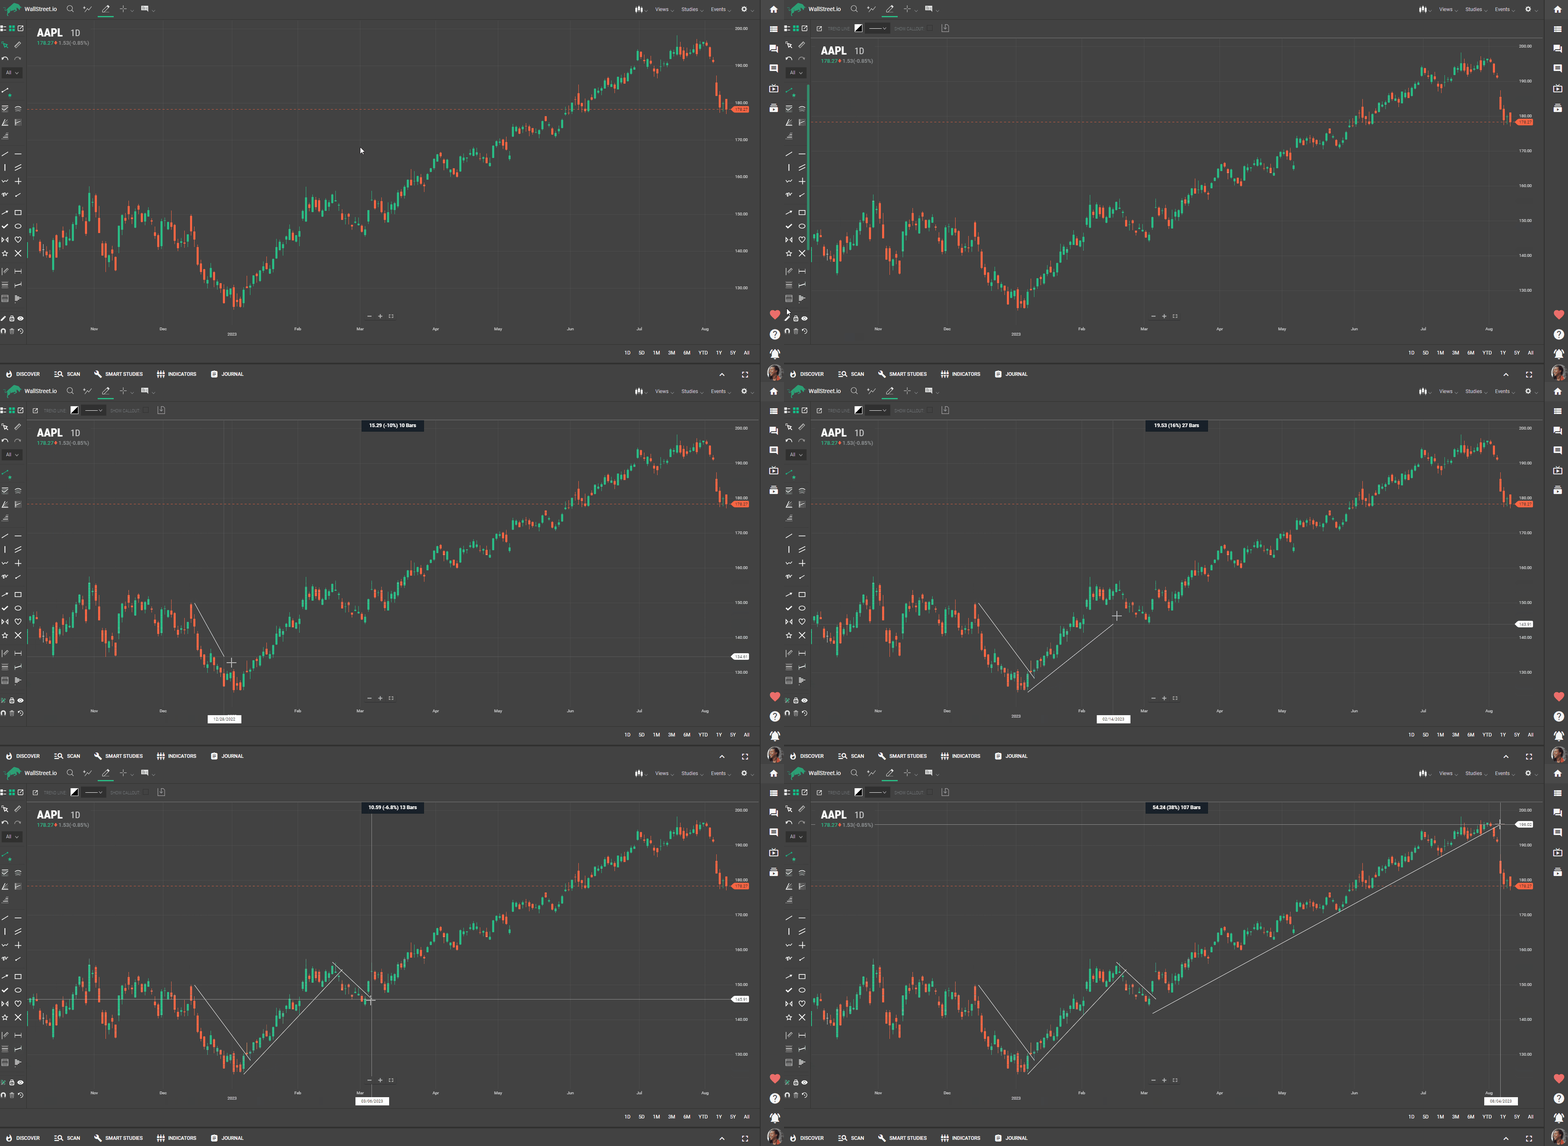
Locking Drawings
To prevent accidental edits, click 'lock drawings' to disable any changes to drawings.
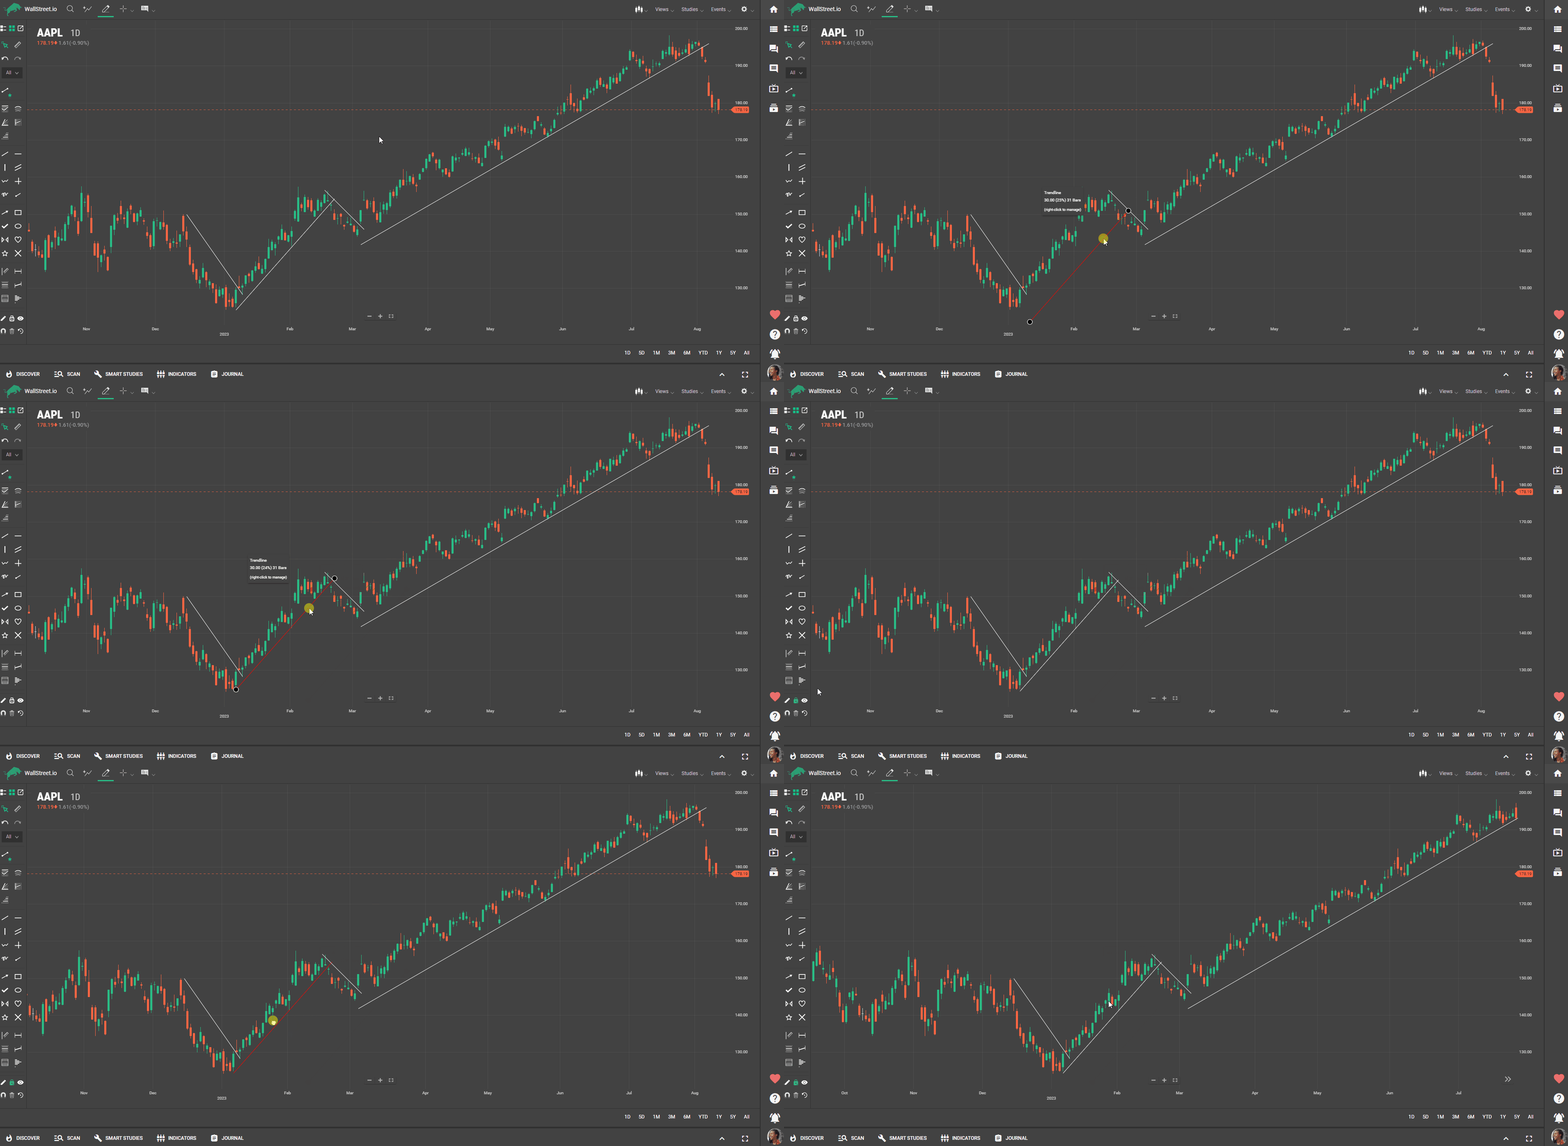
Drawing Visibility
To hide or show your drawings without deleting them, use the 'drawing visibility' toggle.
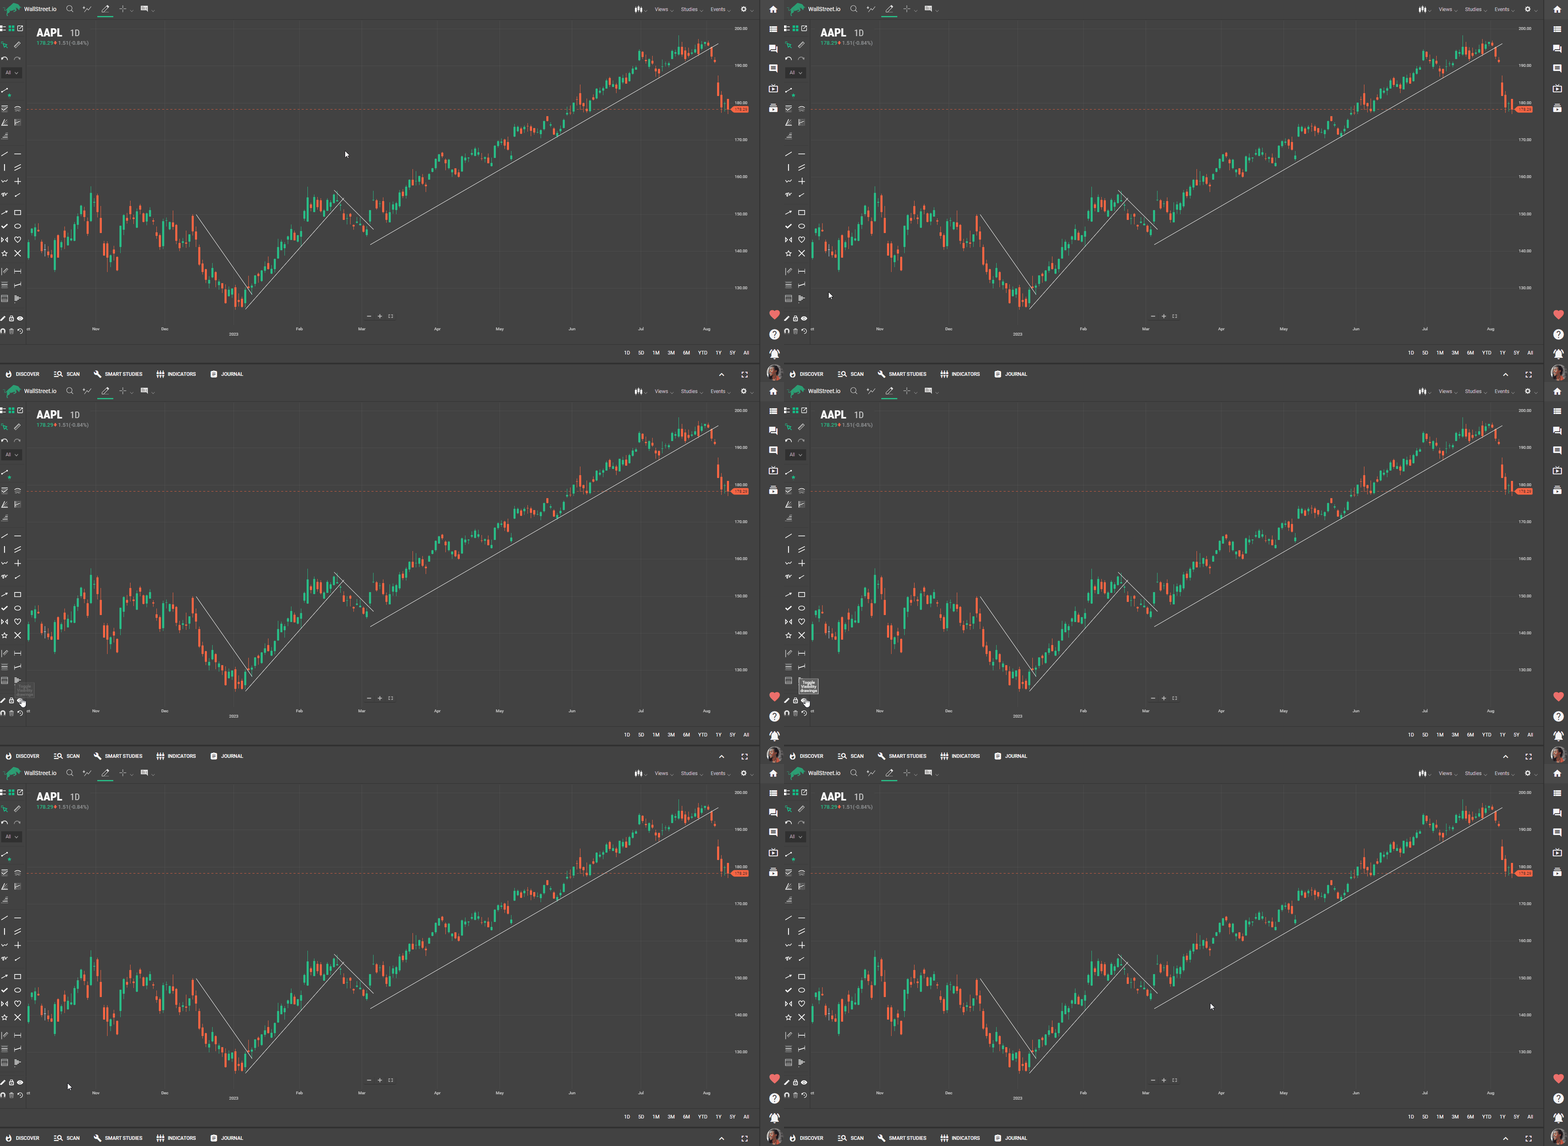
Using the Magnet Feature
The magnet tool ensures your drawings stick to key price points of candlesticks. This is especially useful for precision.
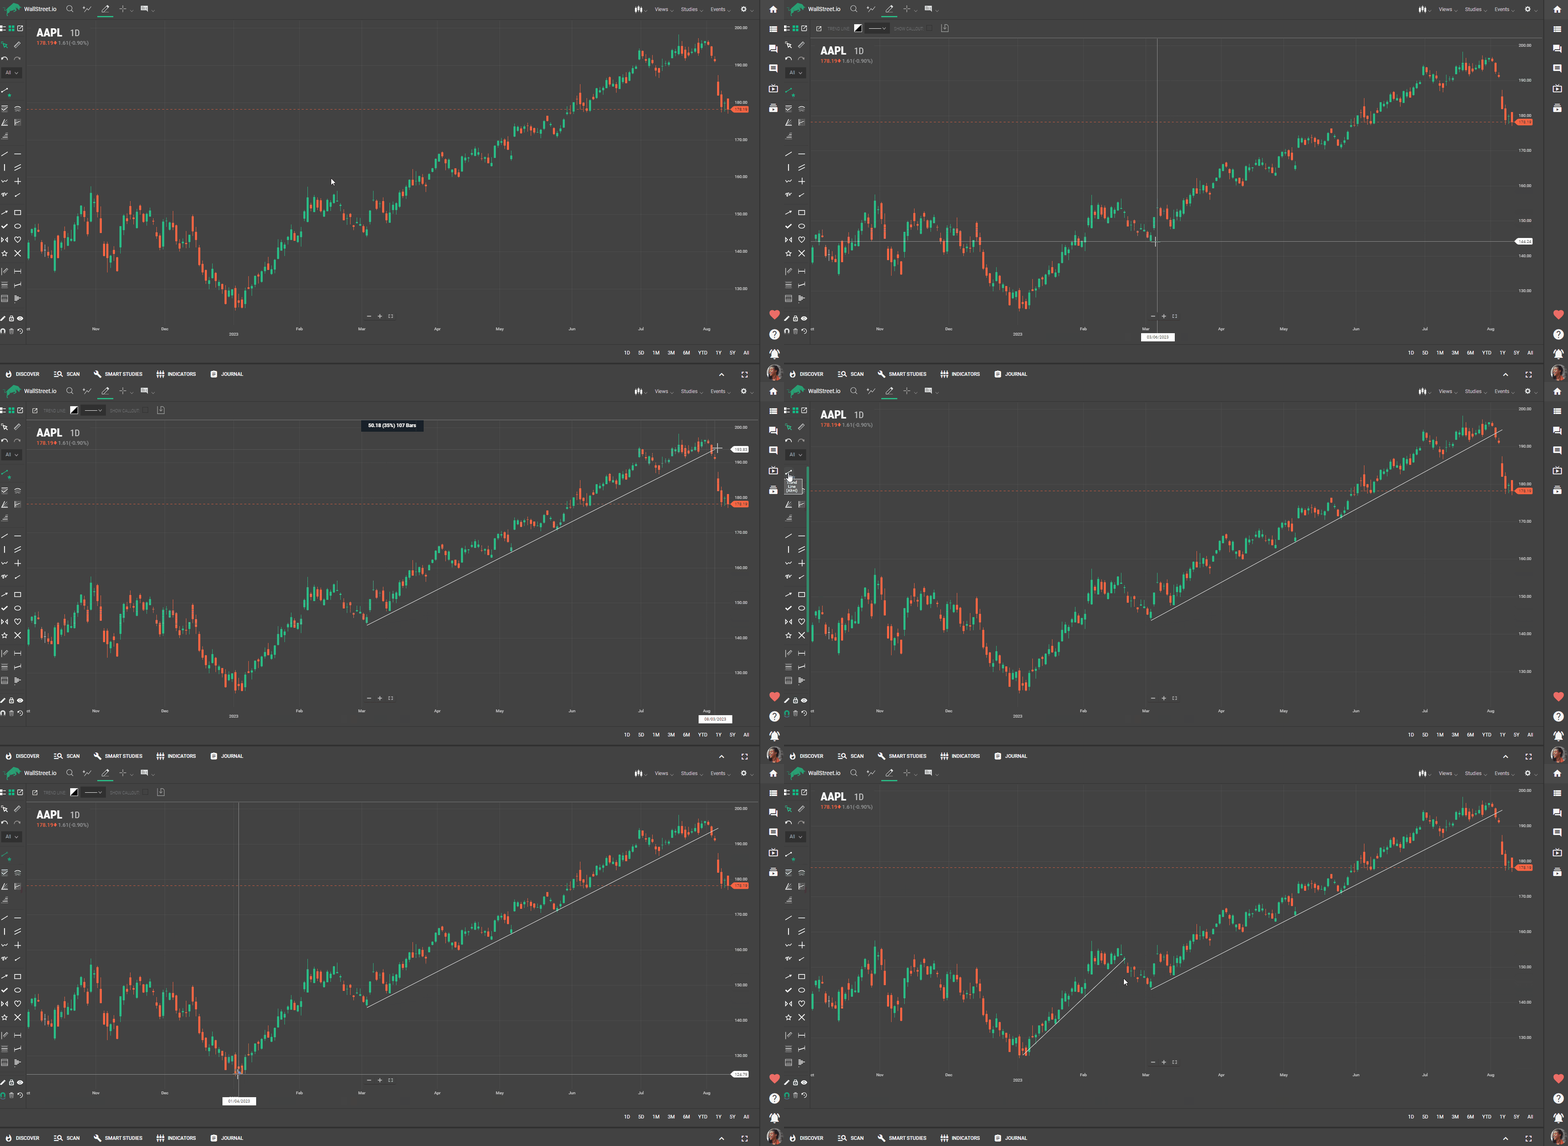
Deleting Drawings
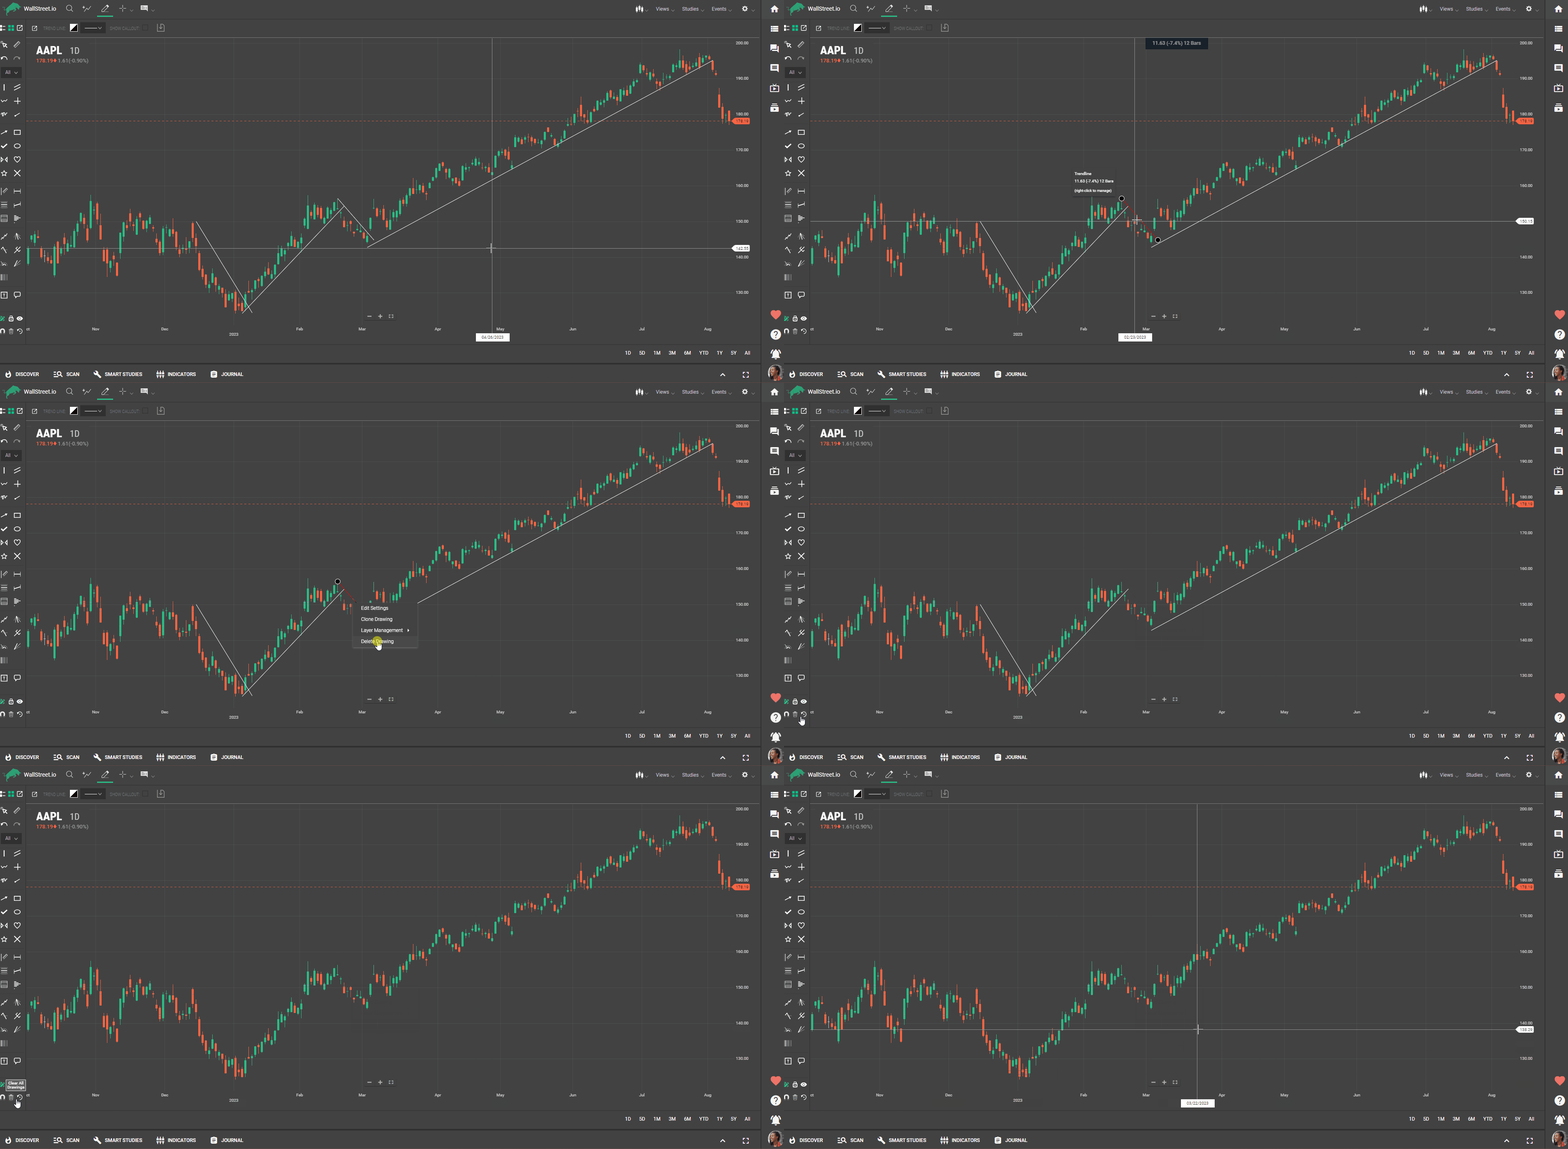
Delete individual drawings by either right-clicking and selecting "Delete" or pressing the delete key when the drawing is highlighted. Clear all drawings with the trash icon.
Restoring Default Parameters
Each drawing tool has default configurations that can be edited.
To save a configuration to use later, click on “Save Config” in the Styling window.
To reset a the configuration for a single tool, click the 'X' next to its settings in the Styling window. To reset all tools to default settings, click 'restore default parameters'.
Advanced Tool Settings
Some tools, like the Fibonacci retracement tool, offer advanced settings accessible through the gear icon.
Cloning Drawings
To duplicate a drawing, right-click on the drawing and select 'clone drawing'.
Layer Management
Drawings have their own set of layers. To change the order of these layers, right-click a drawing, select 'layer management', and choose to bring the drawing to the top or send it back.
Keyboard Shortcuts
Many drawing tools have keyboard shortcuts, visible when you hover over a tool or in the 'shortcuts' -> 'hotkeys' section in the settings menu.
Attach/Detach the Drawing Palette
Drag the detached palette using the drag strip at the top of the palette. Dock the palette back again by selecting the Attach control.
With these features, you can draw on charts, measure moves, set your favorite tools, lock or hide your drawings, and much more. It's a powerful way to enhance your chart analysis!
How to create a drawing
To draw on a chart or study:
1. Select a tool from the palette. On desktop browsers, crosshairs appear, indicating the position of the tool.2. Click or press to begin the drawing. (Release the mouse button or lift your finger or stylus from the screen.)
On touch devices, crosshairs appear, indicating the starting point of the drawing; the crosshairs are positioned slightly up and to the left of your finger or stylus.3. Move the mouse or your finger or stylus to the endpoint of the drawing.4. Click or press to end the drawing.
On touch devices, the crosshairs move to the endpoint of the drawing.How to use the Fibonacci tools
1. Select the Fibonacci option from the dropdown menu on the Drawing Palette.2. Choose the specific Fibonacci tool you want to use from the available options. Common Fibonacci tools include:Fibonacci Retracement: Measures potential retracement levels within a trend.Fibonacci Projection: Estimates potential price targets or extensions beyond the current trend.Fibonacci Arc: Identifies potential support and resistance levels based on arcs drawn from Fibonacci retracement levels.Fibonacci Fan: Creates diagonal lines based on Fibonacci retracement levels to identify potential support and resistance.3. On the chart, identify the starting point from which you want to apply the Fibonacci tool. Typically, this is a significant swing high or swing low point in the price movement.4. Click and hold the mouse button at the starting point, then drag the cursor to the desired endpoint or area where you want to apply the Fibonacci tool. This could be a swing high or low point, a potential target area, or a range of interest.Pro Tip: Pay attention to key Fibonacci levels like 38.2%, 50%, and 61.8%. These levels are often considered significant in terms of potential price reactions or trend continuation.
5. Release the mouse button to generate the Fibonacci tool. The platform will automatically plot the Fibonacci levels, lines, or arcs based on the selected tool and the points you marked.6. Analyze the generated Fibonacci tool to identify potential support and resistance levels, price retracement levels, or price extension targets.Fibonacci tools work best when used in conjunction with other technical analysis tools and indicators. Consider combining them with trend lines, moving averages, or oscillators to validate potential price levels or targets.
How to use the Line Drawing Tools
1. Select the Line option from the dropdown menu on the Drawing Palette.2. Choose the specific line-type tool you want to use from the available options. Common line-type tools include:Trendline: Draws a straight line that connects two or more significant price points to identify a trend direction.Ray: Draws a straight line from a starting point that extends infinitely in one direction, providing potential support or resistance levels.Channel: Constructs parallel lines that encompass price action within a defined range, indicating potential support and resistance boundaries.3. On the chart, identify the relevant points or data where you want to apply the line-type tool. For trendlines, this involves identifying significant swing high or low points that define the trend. For rays or channels, pinpoint key areas where price has shown support or resistance.4. Click and hold the mouse button at the starting point of the line, then drag the cursor to the desired endpoint or area where you want to apply the line-type tool.5. Release the mouse button to generate the line-type tool. The software will automatically plot the line, ray, or channel based on the selected tool and the points you marked.6. Analyze the generated drawing to identify trend directions, potential support and resistance levels, or price channels.Tips
Multiple timeframes: Apply line-type tools on multiple timeframes to identify confluence zones where trendlines, rays, or channels align across different time periods. This can provide stronger support or resistance areas.Focus on key breaks and touches: Pay attention to price action around trendlines, rays, or channel boundaries. Look for breaks of trendlines, bounces off support/resistance lines, or price reactions around channel boundaries for potential trading opportunities.Revisit and adjust: Market conditions change over time, so regularly review and adjust your line-type tools to reflect new price developments. Consider redrawing trendlines or adjusting channel boundaries as the market evolves.How to use the Technical Drawing Tools
1. Select the Technical option from the dropdown menu on the Drawing Palette.2. Choose the specific technical tool you want to use from the available options. Some common technical tools include:Elliott Wave: Helps identify patterns and cycles in market price movements to forecast future price direction.Gann Fan: Constructs diagonal trend lines based on specific angles to identify potential support and resistance levels.Gartley: A harmonic pattern tool that helps identify potential reversal points in the market based on specific ratios and Fibonacci levels.Pitchfork: Constructs parallel trend lines around a median line to identify potential support and resistance zones.Speed Resistance Arc: Plots arcs based on specific angles to identify potential support and resistance levels.Speed Resistance Line: Draws trend lines based on specific angles to identify potential support and resistance levels.Time Cycle: Analyzes historical price patterns to identify potential future market turning points based on cyclical behavior.3. On the chart, identify the relevant data or points where you want to apply the technical tool. This could involve identifying specific price swings, trend reversals, or significant historical data.4. Adjust the parameters of the chosen technical tool. This may include specifying the starting and ending points, adjusting angles or ratios, or selecting specific data ranges.5. Apply the drawing on the chart by following the software's guidelines. This may involve drawing lines, angles, arcs, or other graphical representations based on the selected drawing.6. Analyze the generated technical tool to identify potential patterns, support and resistance levels, trend channels, or market cycles.How to manage drawings
Drawings can be repositioned and resized by drag-and-drop interactions.
1. Drag and drop a drawing to move it to another location. 2. Drag the start and end points of a drawing to change the drawing’s shape and size. 3. To reveal the start and end points of a drawing, hover your mouse over the drawing; on touch devices, tap the drawing.Note: Drawings scale across different periodicities.
How to use the Average Line
Average Line drawings can be applied to any rendered series or study line, not
just the primary series. To draw an average line using a mouse:
1. Hover over a series or study line (for example, the Jaws of an Alligator
study)2. Click the line and release the mouse button to mark the starting point of
the average3. Move the mouse left or right4. Click the mouse to mark the endpoint of the average
To draw an average line on mobile devices:5. Tap a series or study line on the screen to mark the starting point of the
average6. Tap elsewhere on the series or study line to mark the endpoint of the
average
How to use Elliott Waves drawings
How to draw Elliott Waves
Mouse
1. Select the Elliott Wave tool from the drawing palette.2. Optional: Select the Magnet icon at the bottom of the drawing palette.3. Click a data point (or other location) on the chart to begin the drawing.
The starting point of the wave is labeled with the start of the wave count. The endpoint of
the wave is labeled with the next number in the wave count.4. Click the next data point on the wave.
The crest of the wave is labeled with the current wave count.5. Continue to select points until the wave is complete.
As you move your mouse, a portion of the chart is highlighted (the drop zone) to indicate
where the next data point must be selected.
Also, a display at the top of the chart shows the following about the
data point at the mouse cursor position:
● Change in the value from that of the previous wave crest
● Percentage change in value
● Number of data points included in the waveMobile or touchscreen
1. Select the Elliott Wave tool from the drawing palette.2. Optional. Select the Magnet icon at the bottom of the drawing palette.3. Tap a data point (or other location) on the chart to begin the drawing.4. Touch the screen and slide your finger (or stylus) to the next point on the wave.
The starting point of the wave is labeled with the start of the wave count. The endpoint of
the wave is labeled with the next number in the wave count.5. Lift your finger or stylus at the next point on the wave.6. Tap the position to set the endpoint of the wave.
The crest of the wave is labeled with the current wave count.7. Touch the screen and slide your finger (or stylus) to the next point on the wave.
A portion of the chart is highlighted (the drop zone) to indicate where the next data point
must be selected.8. Tap the position to set the endpoint of the wave.
The crest of the wave is labeled with the current wave count.9. Repeat steps seven and eight until the wave is complete.To adjust the wave crests
Mouse
1. Hover the mouse over the wave drawing.
Small circles denoting the crests of the waves appear next to the wave count labels.2. Click and drag a circle to a new location on the chart.
A drop zone is highlighted to indicate where the wave crest can be placed.
Mobile or touchscreen
1. Tap the “No Tool” icon to turn off the Elliott Wave drawing tool.2. Tap the wave drawing.
Small circles denoting the crests of the waves appear next to the wave count labels.3. Press and drag a circle to a new location on the chart.
A drop zone is highlighted to indicate where the wave crest can be placed.To move the wave
Mouse
Click any of the wave lines and drag the entire drawing to a new location on the chart.
Mobile or touchscreen
Tap the “No Tool” icon to turn off the Elliott Wave drawing tool.Press and drag the wave to a new position on the chart.To delete a wave
Mouse
1. Hover the mouse over the wave drawing.2. Press the delete key.
Or
1. Right-click the wave drawing to open the context menu.2. Select Delete Drawing.
Or
For a drawing in progress, press the escape key.
Mobile or touchscreen
1. Tap the “No Tool” icon to turn off the Elliott Wave drawing tool.2. Tap the X icon.
Or
For a drawing in progress, tap the “No Tool” icon.
To manage a wave
Mouse
1. Right-click the wave drawing to open the context menu.2. Select an item from the menu:● Edit Settings — Change the style of the wave (see Style palette
below)
● Clone Drawing — Make a copy of the wave drawing
● Layer Management — Position the drawing (on the z-axis) above or below other drawings
● Delete Drawing — Remove the drawing
Mobile or touchscreen
1. Tap the “No Tool” icon to turn off the Elliott Wave drawing tool.2. Tap the wave drawing.3. Tap the gear icon.4. The style palette opens. Change the style of the wave (see Style palette below)


 Discover Tab Reference Guide
 Discover Tab How-To Guide
 Smart Studies How-To Guide
 Smart Studies Reference Guide
 Scan Tab Reference Guide
 Scan Tab How-To Guide
 Watchlists How-To guide
 Watchlists Reference Guide
 Chatrooms Reference Guide
 Community Wall How-To Guide
 Community Wall Reference Guide
 Streams Reference Guide
 Streams How-To Guide