The Discover Tab is a powerful tool that allows you to find the top strategies on the platform quickly. Follow this reference guide to navigate and utilize the features of the Discover Tab effectively:
Accessing the Discover Tab
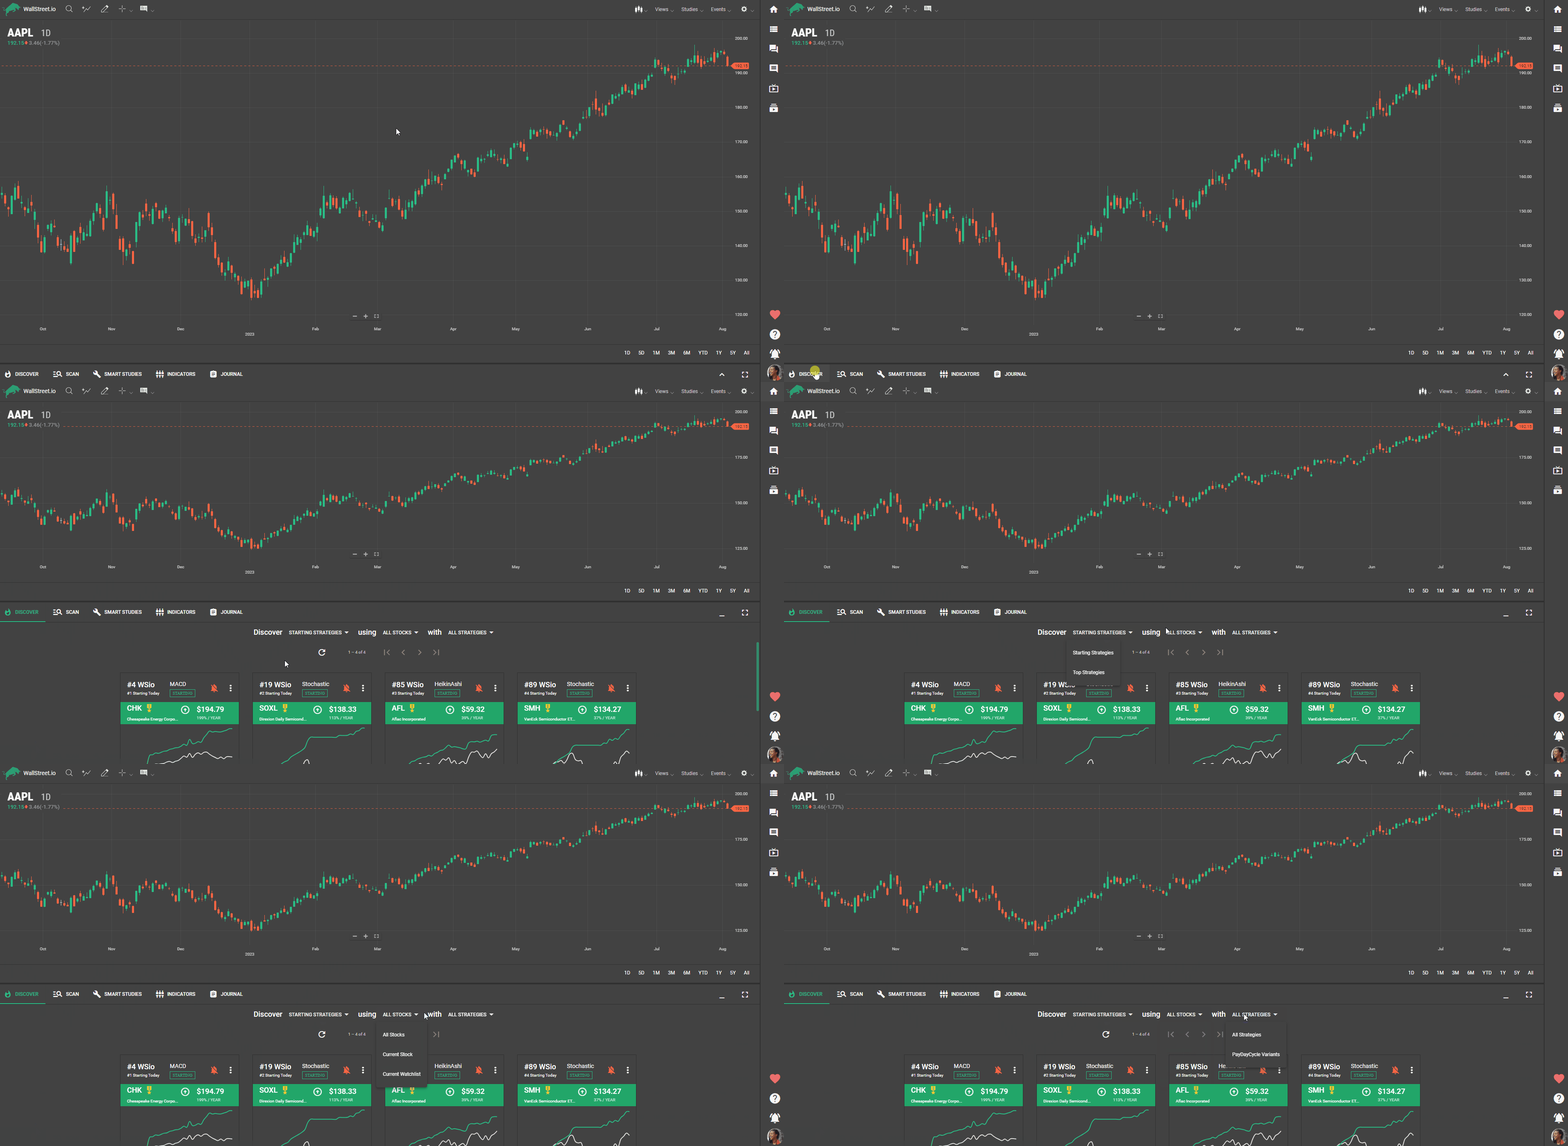
Locate and click on the Discover Tab on the platform, towards the bottom-left side of the main page.The Discover page will load instantly, providing you with access to the top strategies available.
Exploring Strategy Filters
Below the Discover Tab, you will see three tabs with drop-down arrows next to them.The left tab allows you to select "Top Strategies" or "Starting Strategies" using different filter options such as "All Stocks" or "Current Watchlist."The middle tab lets you filter the results based on your current watchlist or a specific stock.The right tab allows you to search for "All Strategies" or choose "PayDay Cycle Variants" that utilize specific indicators like Heikin-Ashi, MACD and others.Select the desired options to instantly narrow down the strategies that appear on the Discover page.Understanding Strategy Cards
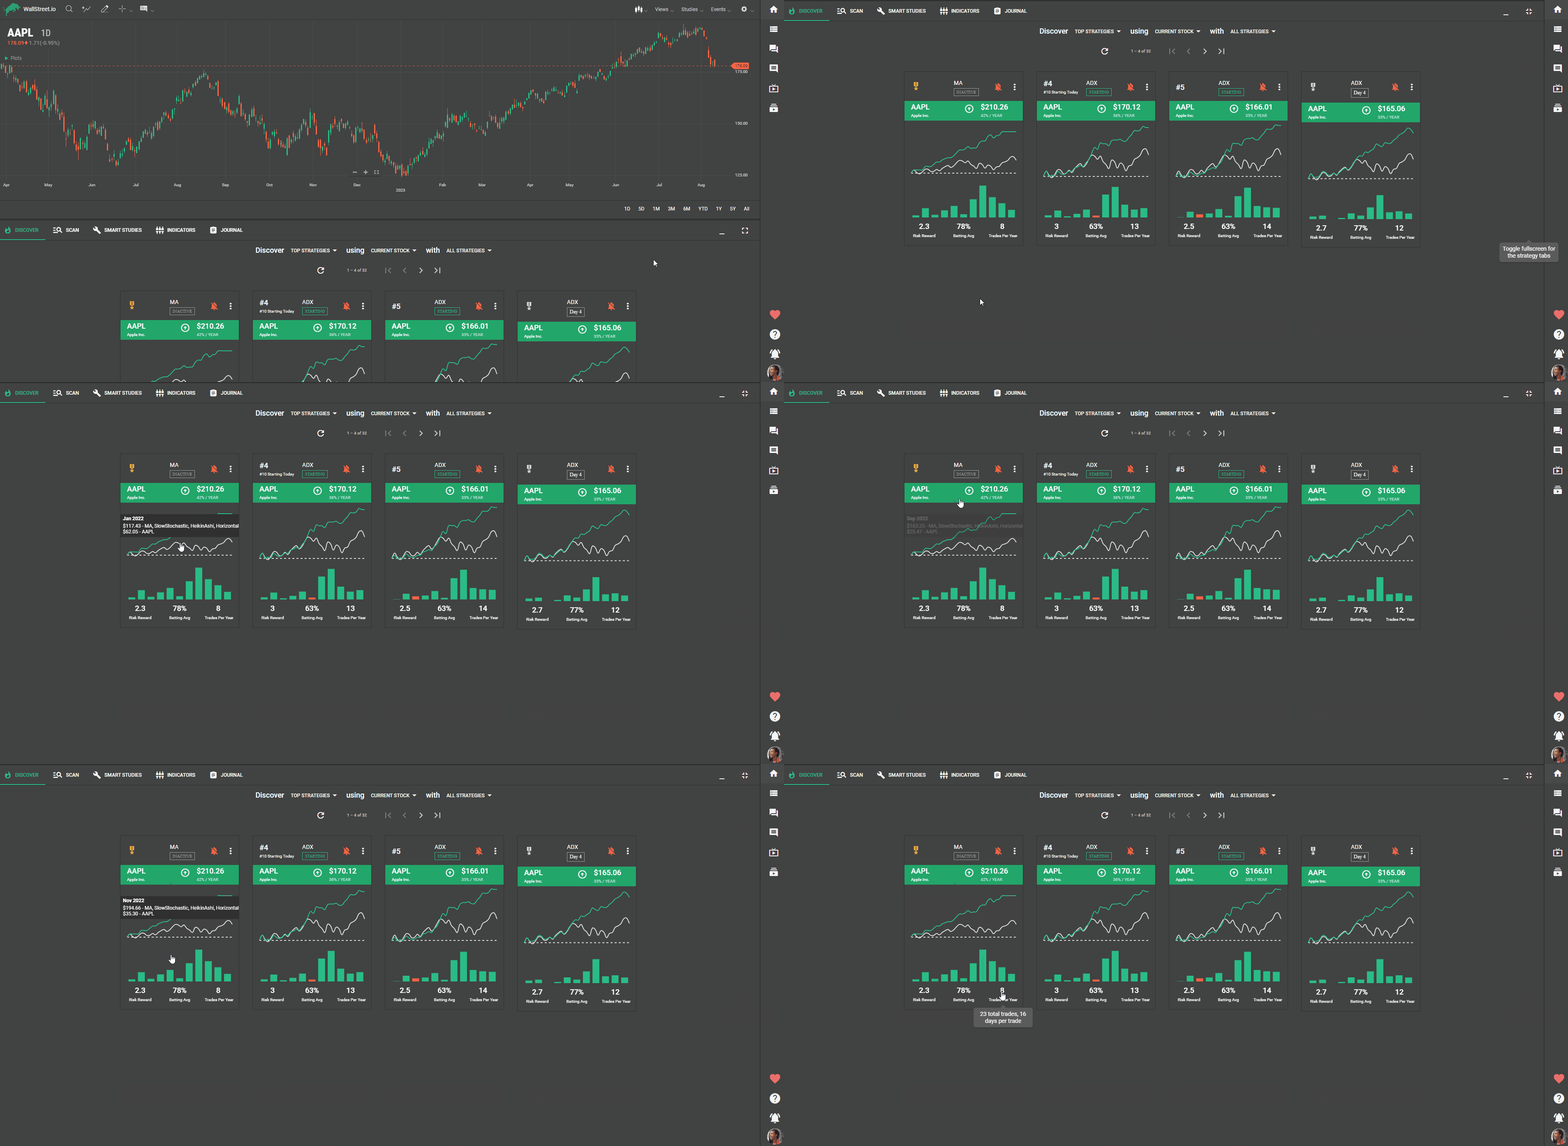
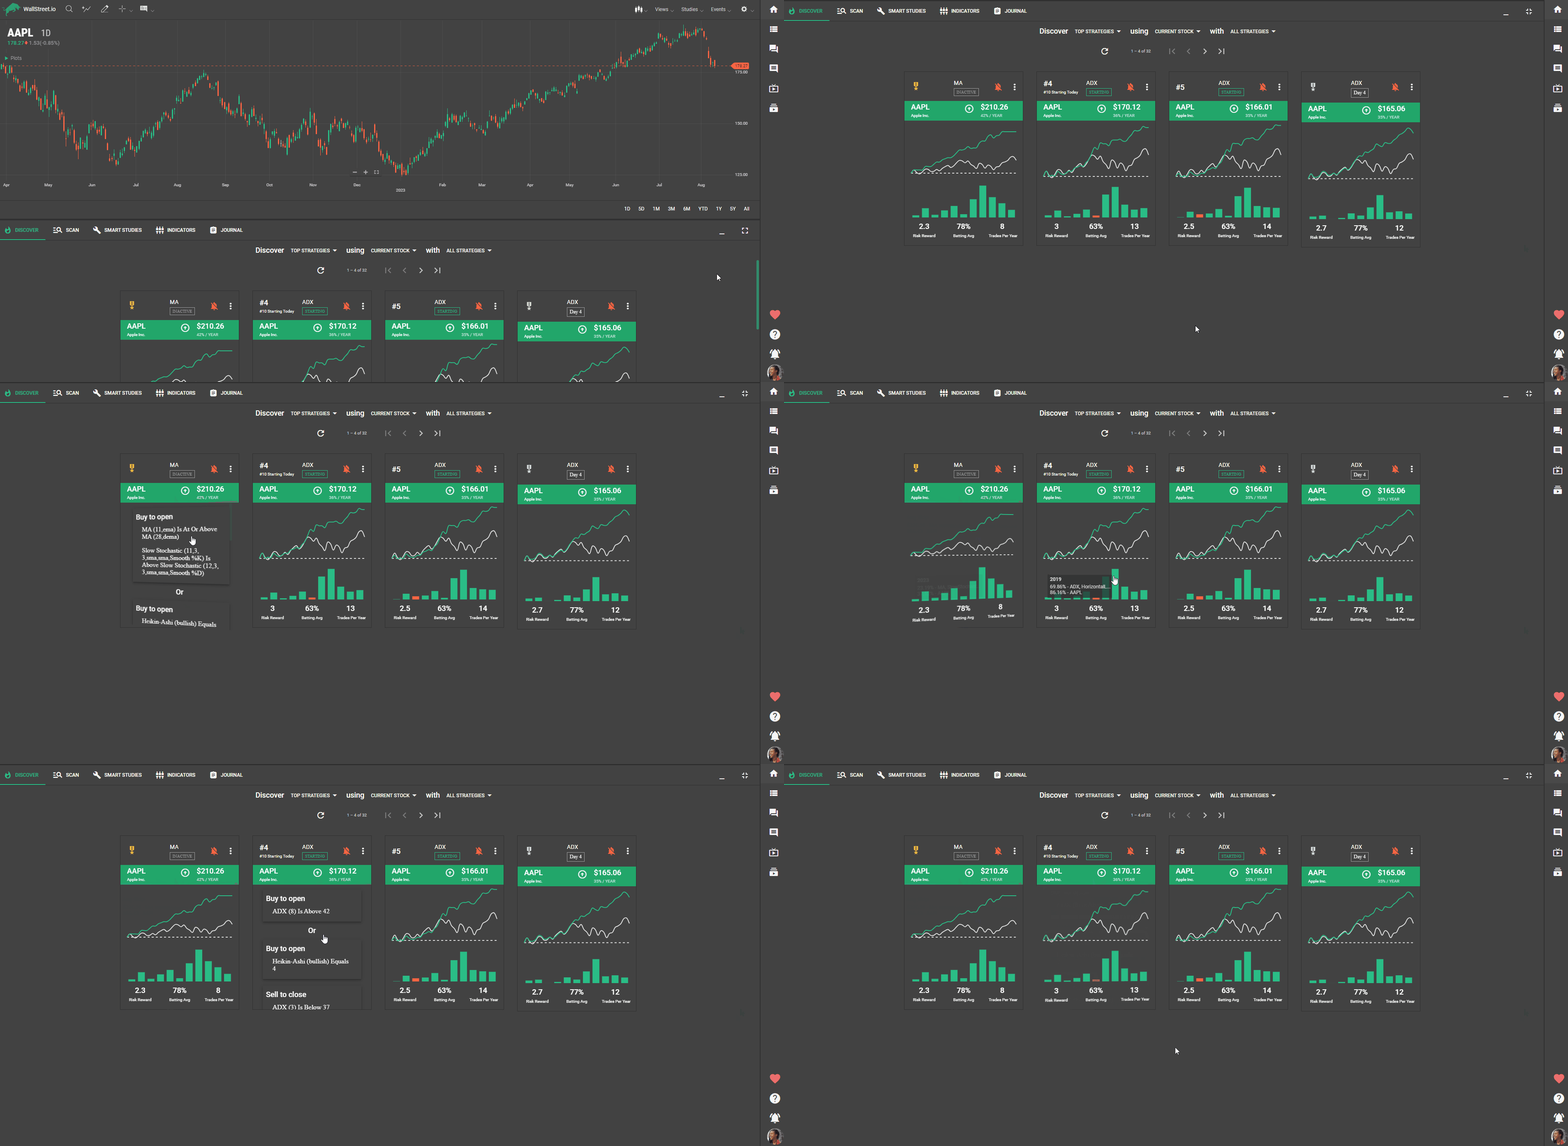
After your search, you will see multiple Strategy cards displayed, each containing a graph and two lines.The green line represents the Smart Studies results of trading one share of the stock or ETF based on the strategy's signals. This green line is also called the profit line.The grey line displays the results of buying and holding one share over the same period.The bar chart below the graph indicates the annual seasonality over the past 10 years for the strategy and buy and hold.Hover over the charts to view additional information about the strategy's trades.
Interacting with Strategy Cards
Click on the bell icon in the top right corner of a Strategy card to follow the strategy.Following a strategy allows you to receive Strategy Notification email alerts when the strategy begins and ends.Hover over the Risk Reward in the lower-left corner to view average percent win and loss.Hover over the Batting Avg to see the number of wins and losses over the past 3 years.Hover over Trades Per Year to display the number of trades and trade length over the past 3 years.
Additional Functions
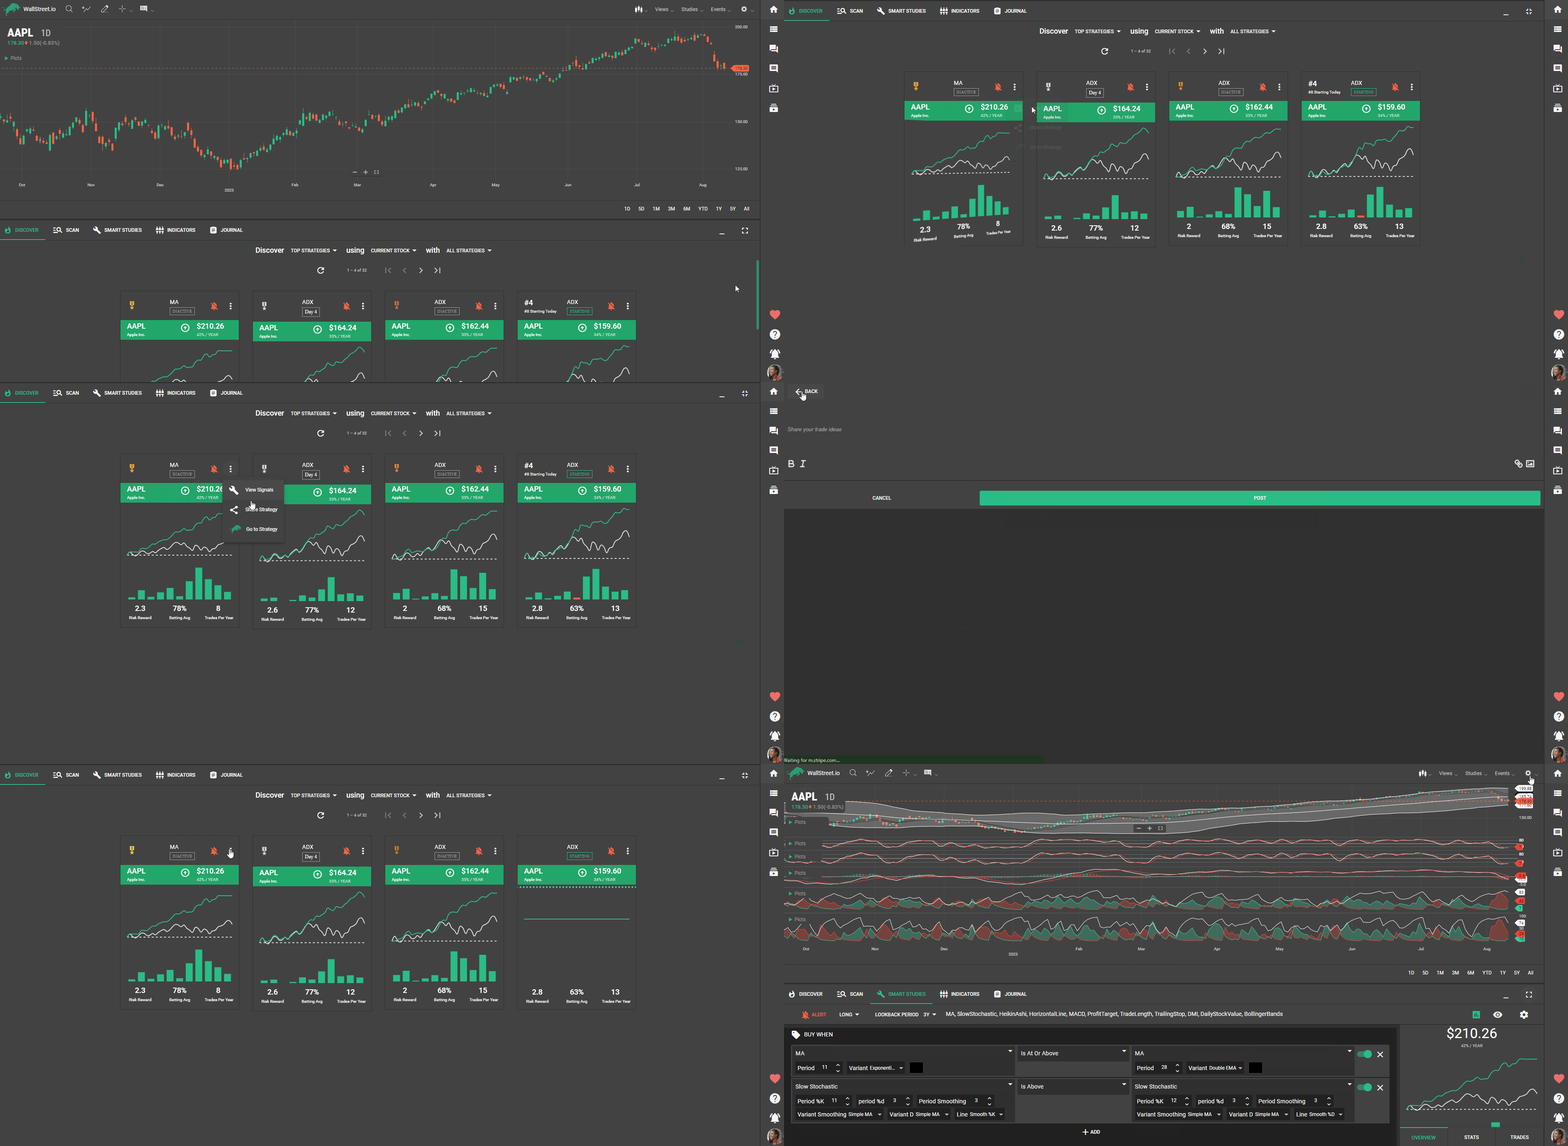
Click the three-dot icon on the upper-right corner of each Strategy card to access more options.Choose "View Signals" to display the elements of the strategy.Select "Share Strategy" to share the strategy on the Community Wall and add a note to initiate a conversation.Click "Go To Strategy" to load the strategy into the Smart Studies Tab, chart page, and view detailed results in the View Stats panel.Follow the strategy by clicking the alert bell below the Smart Studies Tab.
Navigating and Returning
Use the back arrow in your browser to return to the Discover page after viewing a strategy in the Smart Studies Tab. This allows you to perform another search and explore different strategies.Tips:
Pay attention to the medal icons next to the ticker symbol, indicating the strategy's ranking within all strategies for a specific stock.Explore the various filter options to customize your search and discover strategies tailored to your preferences.By using the features of the Discover Tab effectively, you can identify top strategies, analyze their performance, and stay up-to-date with the constantly changing strategies to enhance your trading strategy and explore new opportunities within the markets!


 Discover Tab Reference Guide
 Discover Tab How-To Guide
 Smart Studies How-To Guide
 Smart Studies Reference Guide
 Scan Tab Reference Guide
 Scan Tab How-To Guide
 Watchlists How-To guide
 Watchlists Reference Guide
 Chatrooms Reference Guide
 Community Wall How-To Guide
 Community Wall Reference Guide
 Streams Reference Guide
 Streams How-To Guide