Chart Preferences Reference Guide
Chart preferences
The menu enables you to set a variety of preferences to display your charts just the way you want them.
To set a preference, select the slider next to the preference name.
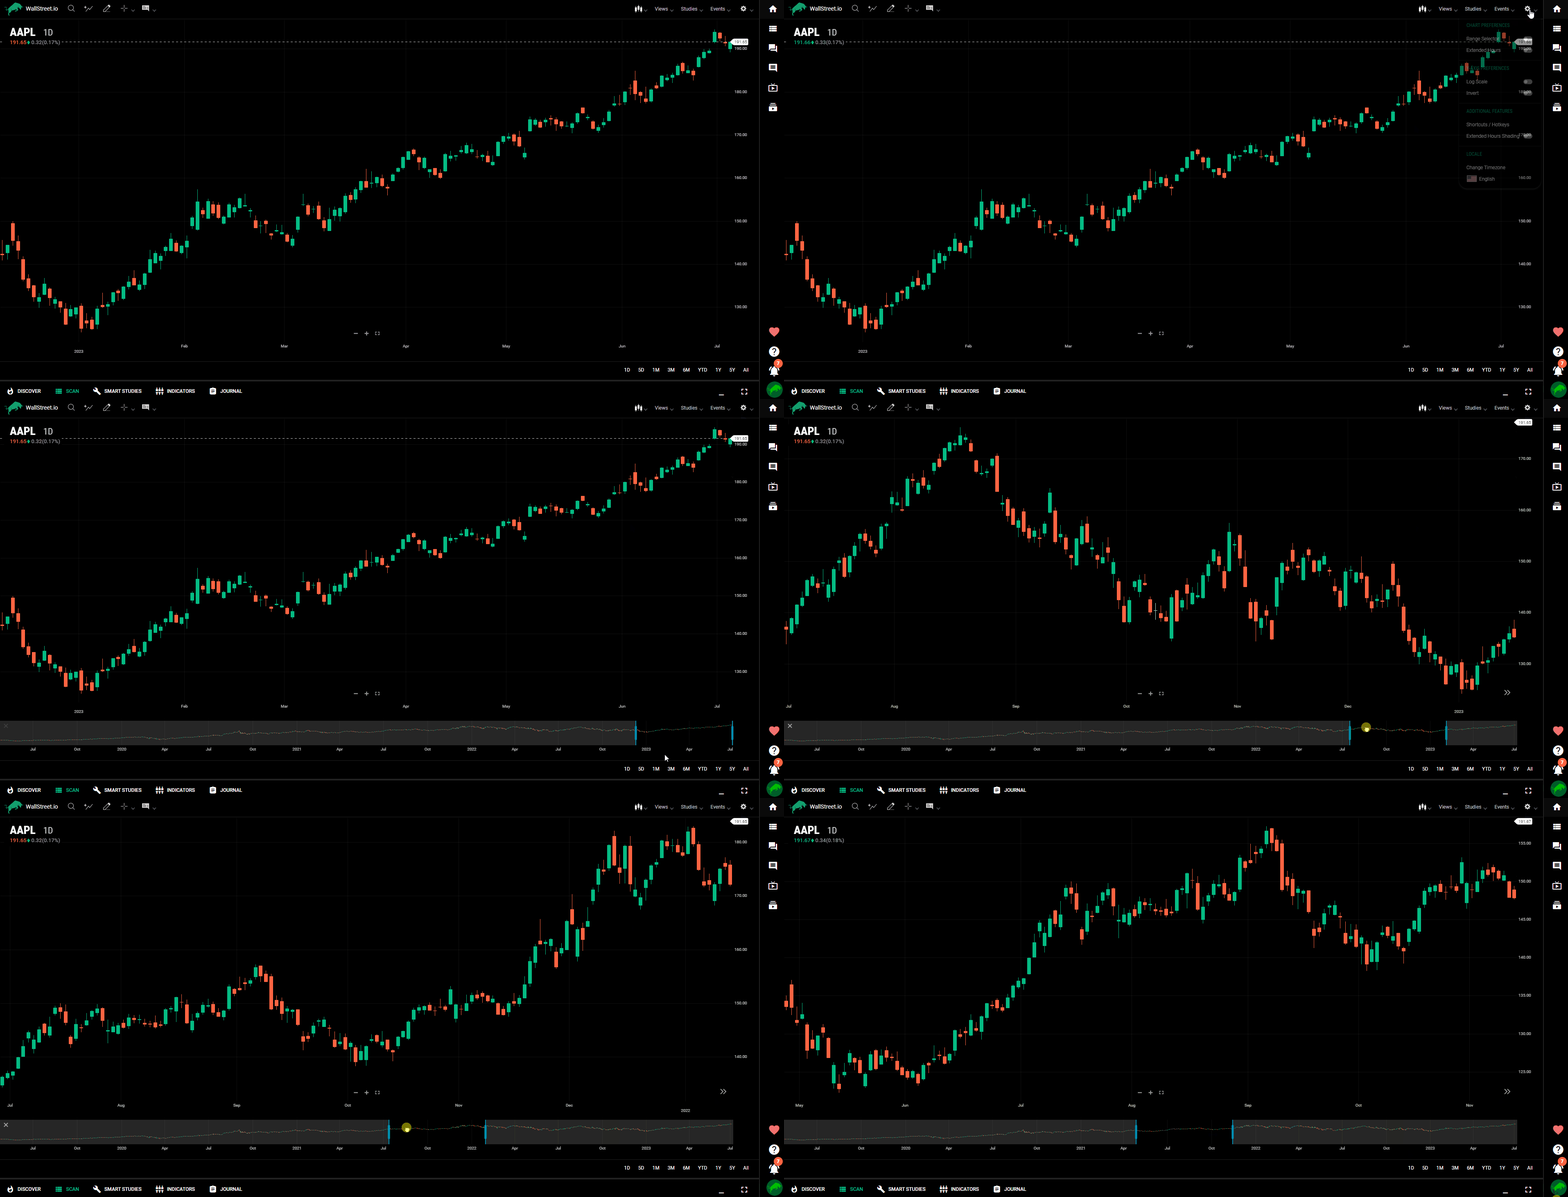
Range Selector
The Range Selector preference opens a panel below the chart. The panel contains more data history than is shown in the primary chart. Drag the controllers in the range selector to control the viewable range of time in the primary chart.

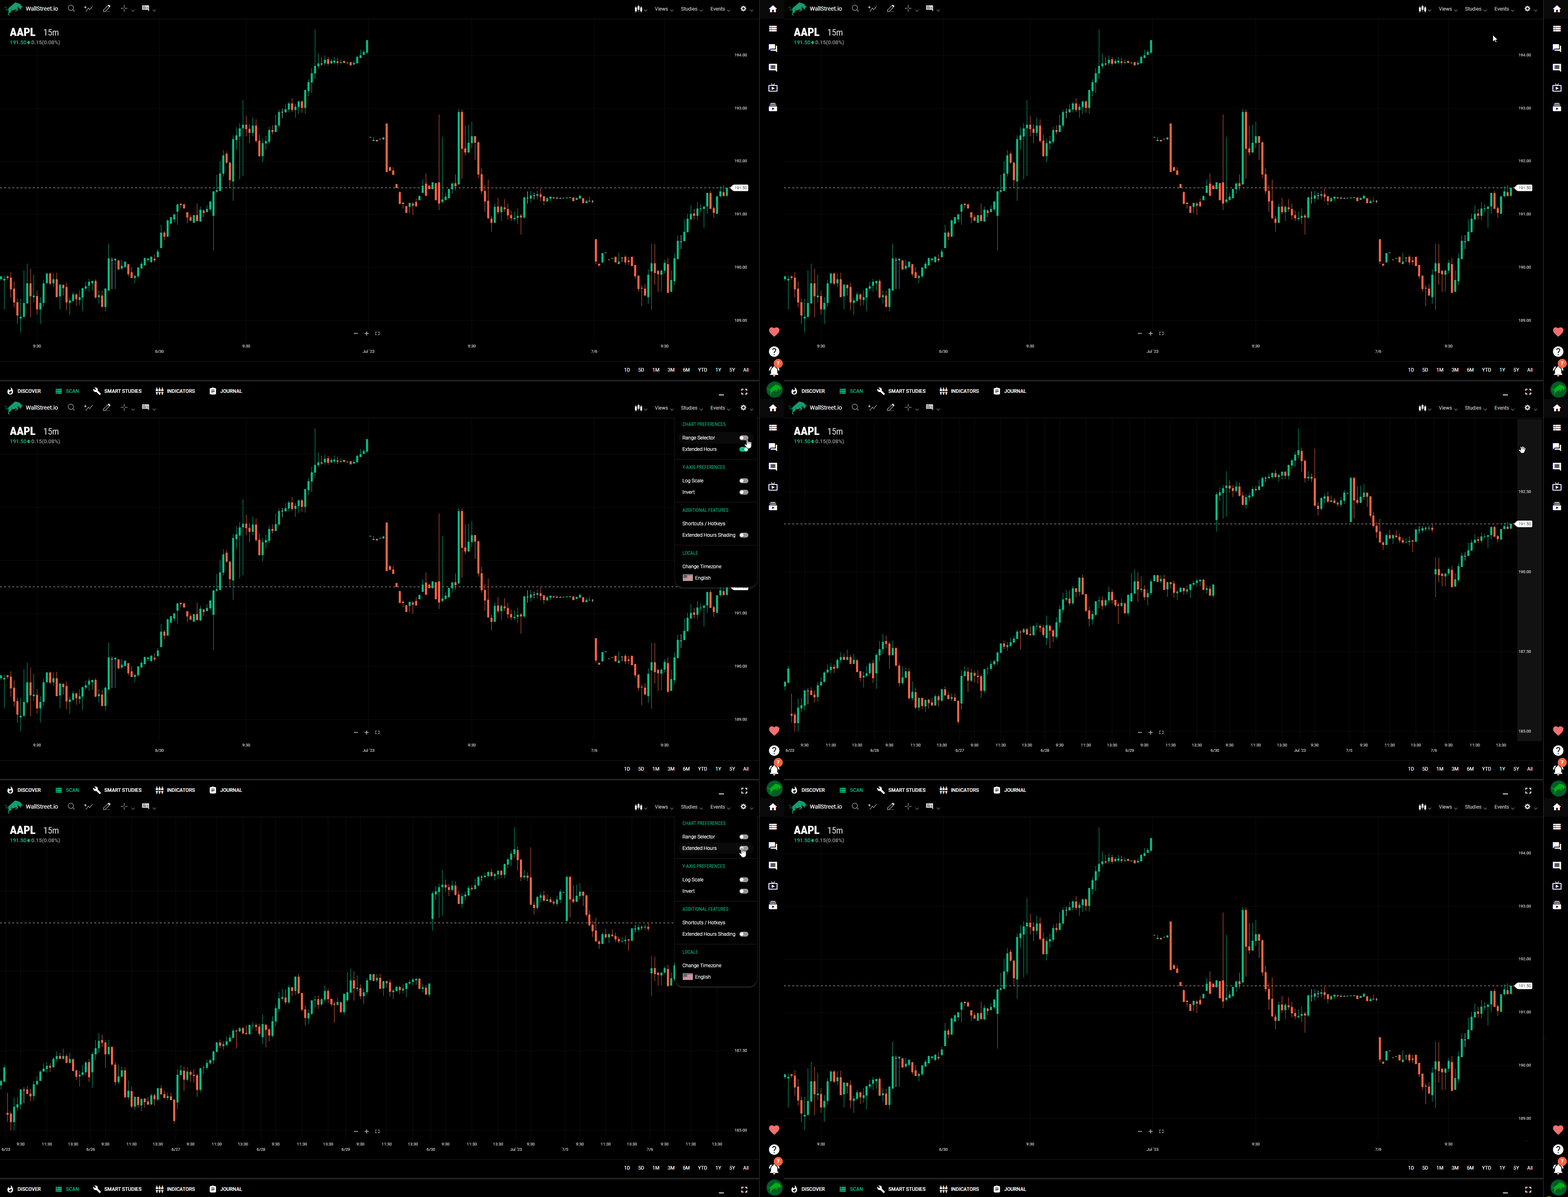
Extended Hours
The Extended Hours preference expands the trading hours of intraday charts to include pre- and post-session trading for U.S. equities. The pre- and post-sessions are highlighted with background shading by default (this can be changed with the Extended Hours Shading toggle button under Additional Features).
Extended hours are particularly useful for observing trading activity during earnings season.

Y-Axis preferences
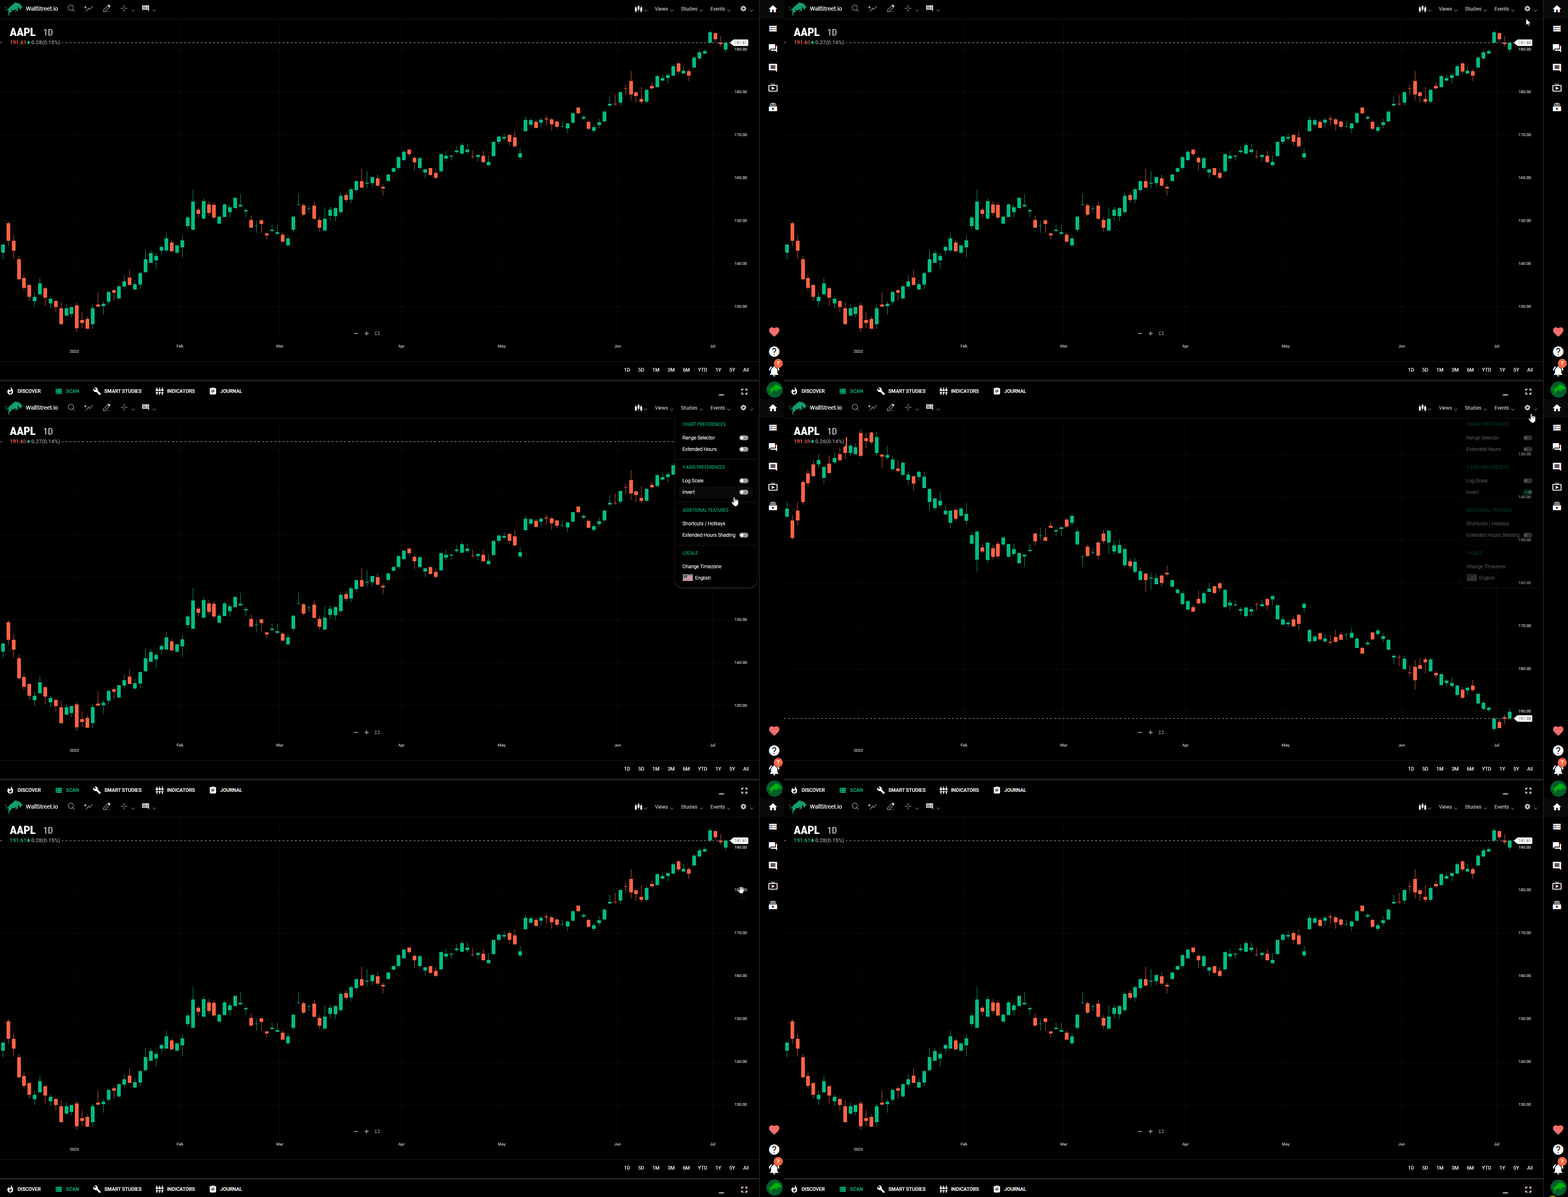
Y-axis preferences enable you to configure the chart vertical axis on a logarithmic scale or invert the price values.
Log Scale
On a logarithmic scale chart, the vertical spacing between two points corresponds to the percentage change between those numbers. Thus, on a log scale chart, the vertical distance between 10 and 20 (a 100% increase) is the same as the vertical distance between 50 and 100. Because these charts show percentage relationships, logarithmic scaling is also called percentage scaling. It is also called semi-log scaling because only the vertical axis is scaled logarithmically.
Charts automatically switch from a log scale to a standard y-axis when the data set includes y-axis values that are less than or equal to zero. The log scale is restored when the chart is refreshed, or new data is retrieved.
Invert
Inverting the y-axis simply flips the chart to display the lowest values at the top and the highest values at the bottom. This will flip the primary line and any drawings or overlay studies applied to the line.
Note: Each study line that is shown in its own panel may be flipped independently.

Additional features
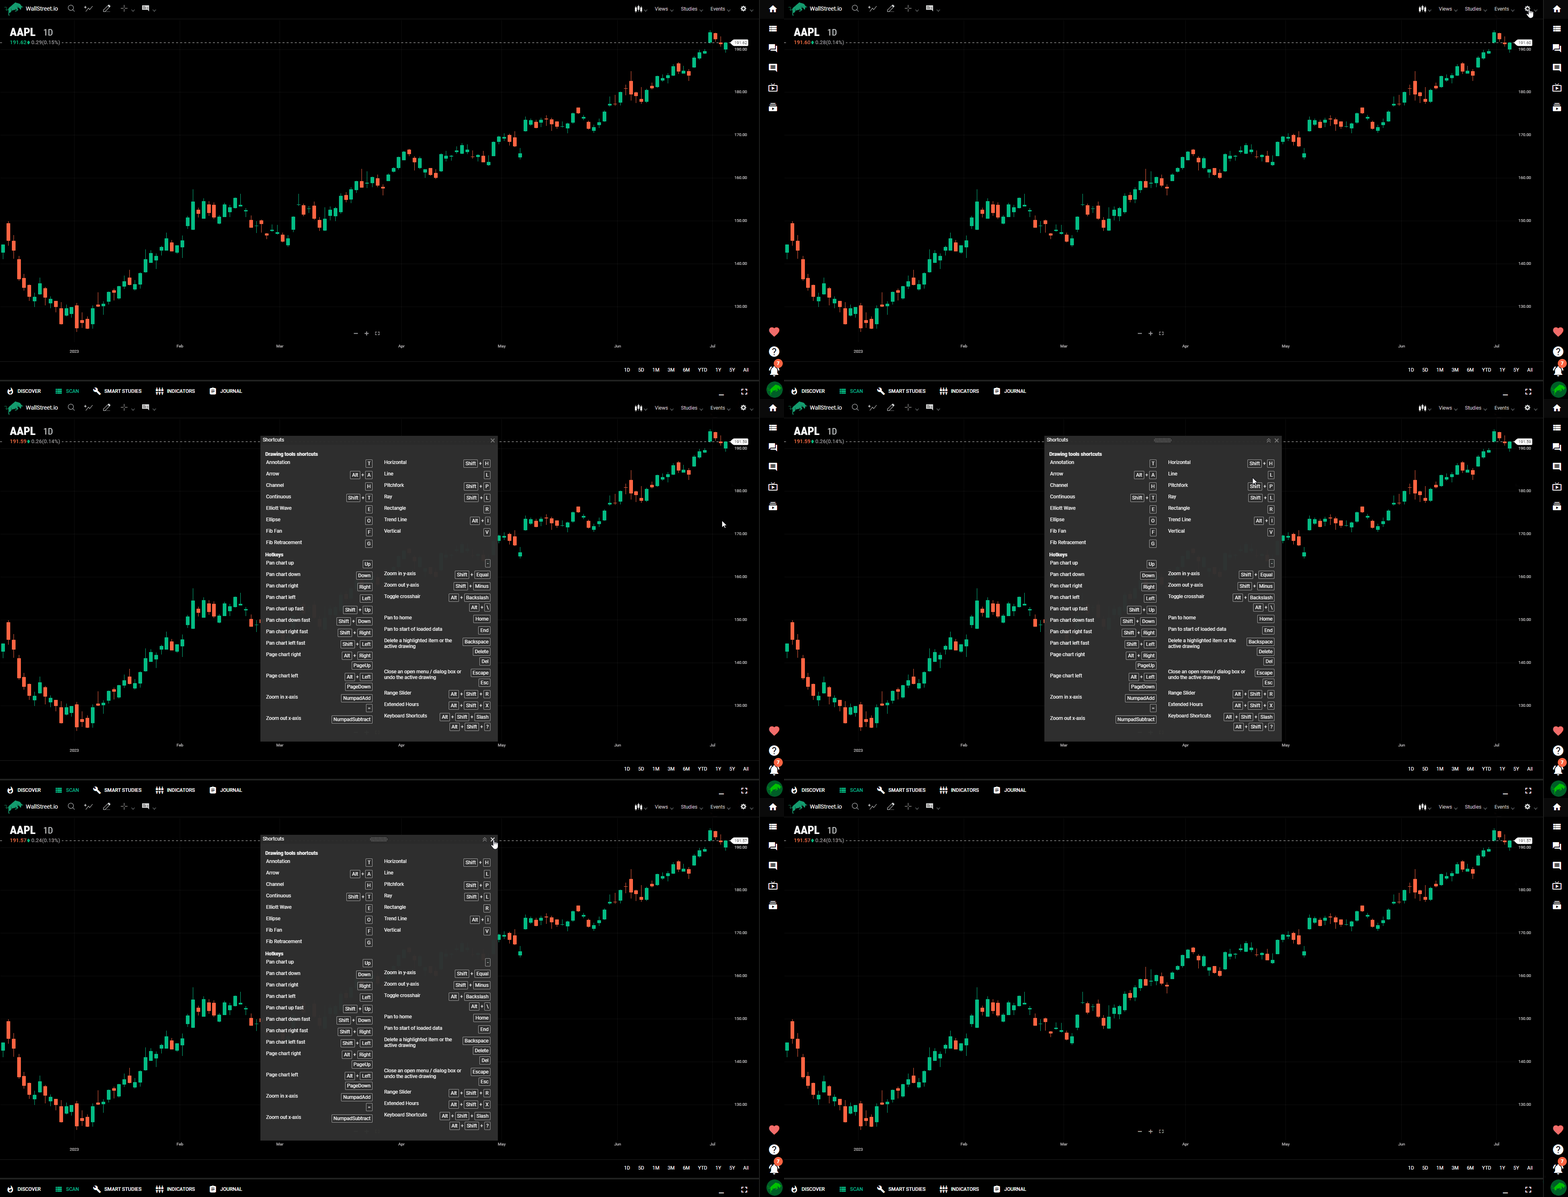
Shortcuts/Hotkeys
Shortcuts and hotkeys make chart functionality accessible from the keyboard. The shortcuts legend displays all keyboard shortcuts and hotkeys. The shortcuts legend is a moveable, resizable window that can be minimized and dragged anywhere within the browser window, including outside the chart.

Locale
Change Timezone
This option will allow you to apply any timezone to the chart data.
Choose Language (under construction)
This option will soon allow you to choose the language of your interface.

 Discover Tab Reference Guide
 Discover Tab How-To Guide
 Smart Studies How-To Guide
 Smart Studies Reference Guide
 Scan Tab Reference Guide
 Scan Tab How-To Guide
 Watchlists How-To guide
 Watchlists Reference Guide
 Chatrooms Reference Guide
 Community Wall How-To Guide
 Community Wall Reference Guide
 Streams Reference Guide
 Streams How-To Guide